TOAST documentation
This is the documentation for TOAST version 2025.295#7434f70e0.
Attention
This documentation refers to the single-user TOAST-legacy version which is being phased out!
Consult https://docs.gempa.de/toast-client/current/ for the online documentation of the new TOAST multi-user version.
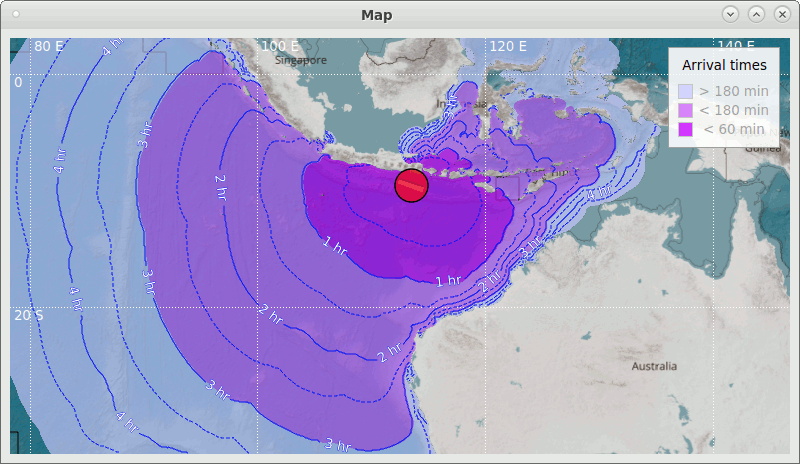
Arrival isolines on maps visualize the tsunami propagation.
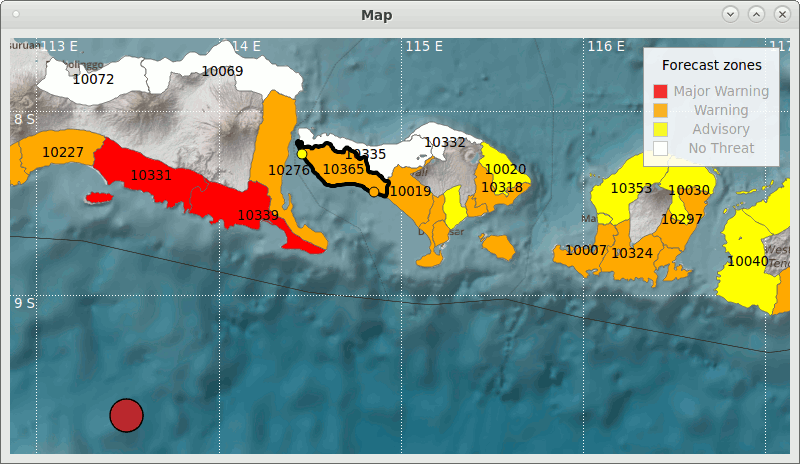
Maps with forecast zones show the threat levels.
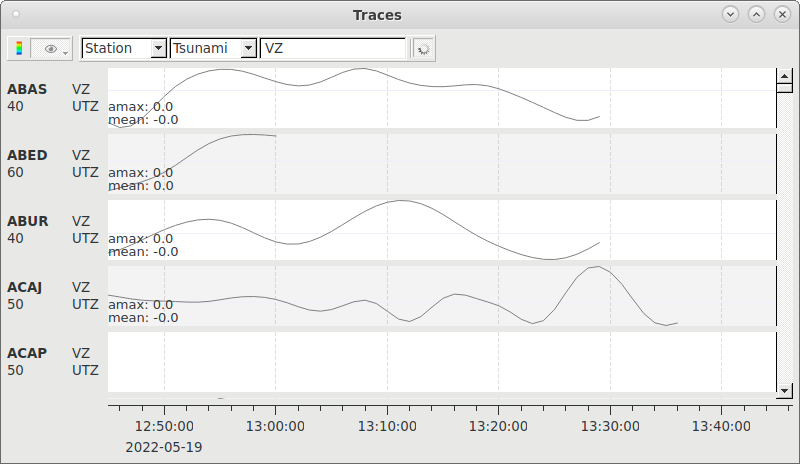
Real-time waveforms provide instantaneous sea-level information and comparison to simulations.
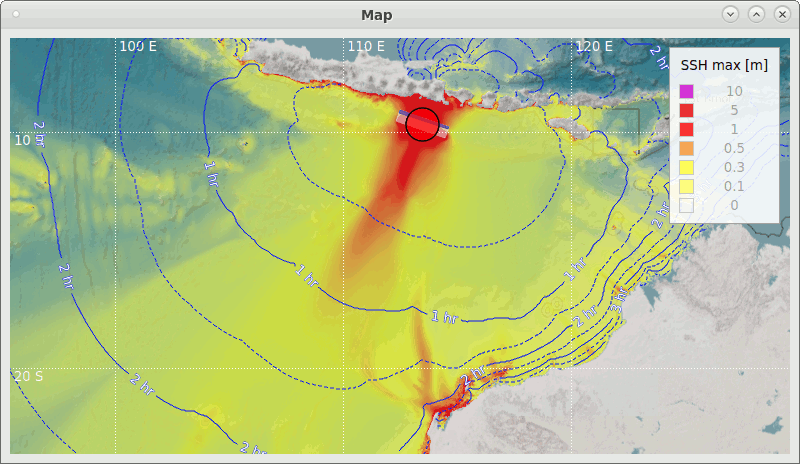
Maps show the maximum wave height across the ocean.
Attention
This documentation refers to the single-user TOAST-legacy version which is being phased out!
Consult https://docs.gempa.de/toast-client/current/ for the online documentation of the new TOAST multi-user version.
Features and Concepts
Installation and Configuration
- Installation
- Setup
- Environment variables
- Secure database installation
- Setup wizard
- Module configuration
- Inventory and Bindings
- Fault geometry configuration
- Forecast zones configuration
- Simulation bathymetry files configuration
- Source regions configuration
- Live tabs and templates configuration
- Color profiles, gradients and colors configuration
- TOAST configuration parameters