Attention
This documentation refers to the single-user TOAST-legacy version which is being phased out!
Consult https://docs.gempa.de/toast-client/current/ for the online documentation of the new TOAST multi-user version.
Simulations
There are several ways to create new simulations:
Automatically via SeisComP messaging connection,
Manually via CTRL+N,
Interactively by the user.
Automatic Simulation and Configuration
Incidents and simulations are automatically triggered for events and event updates received via messaging connection to a SeisComP system. They are initiated if passing multiple filters and thresholds.
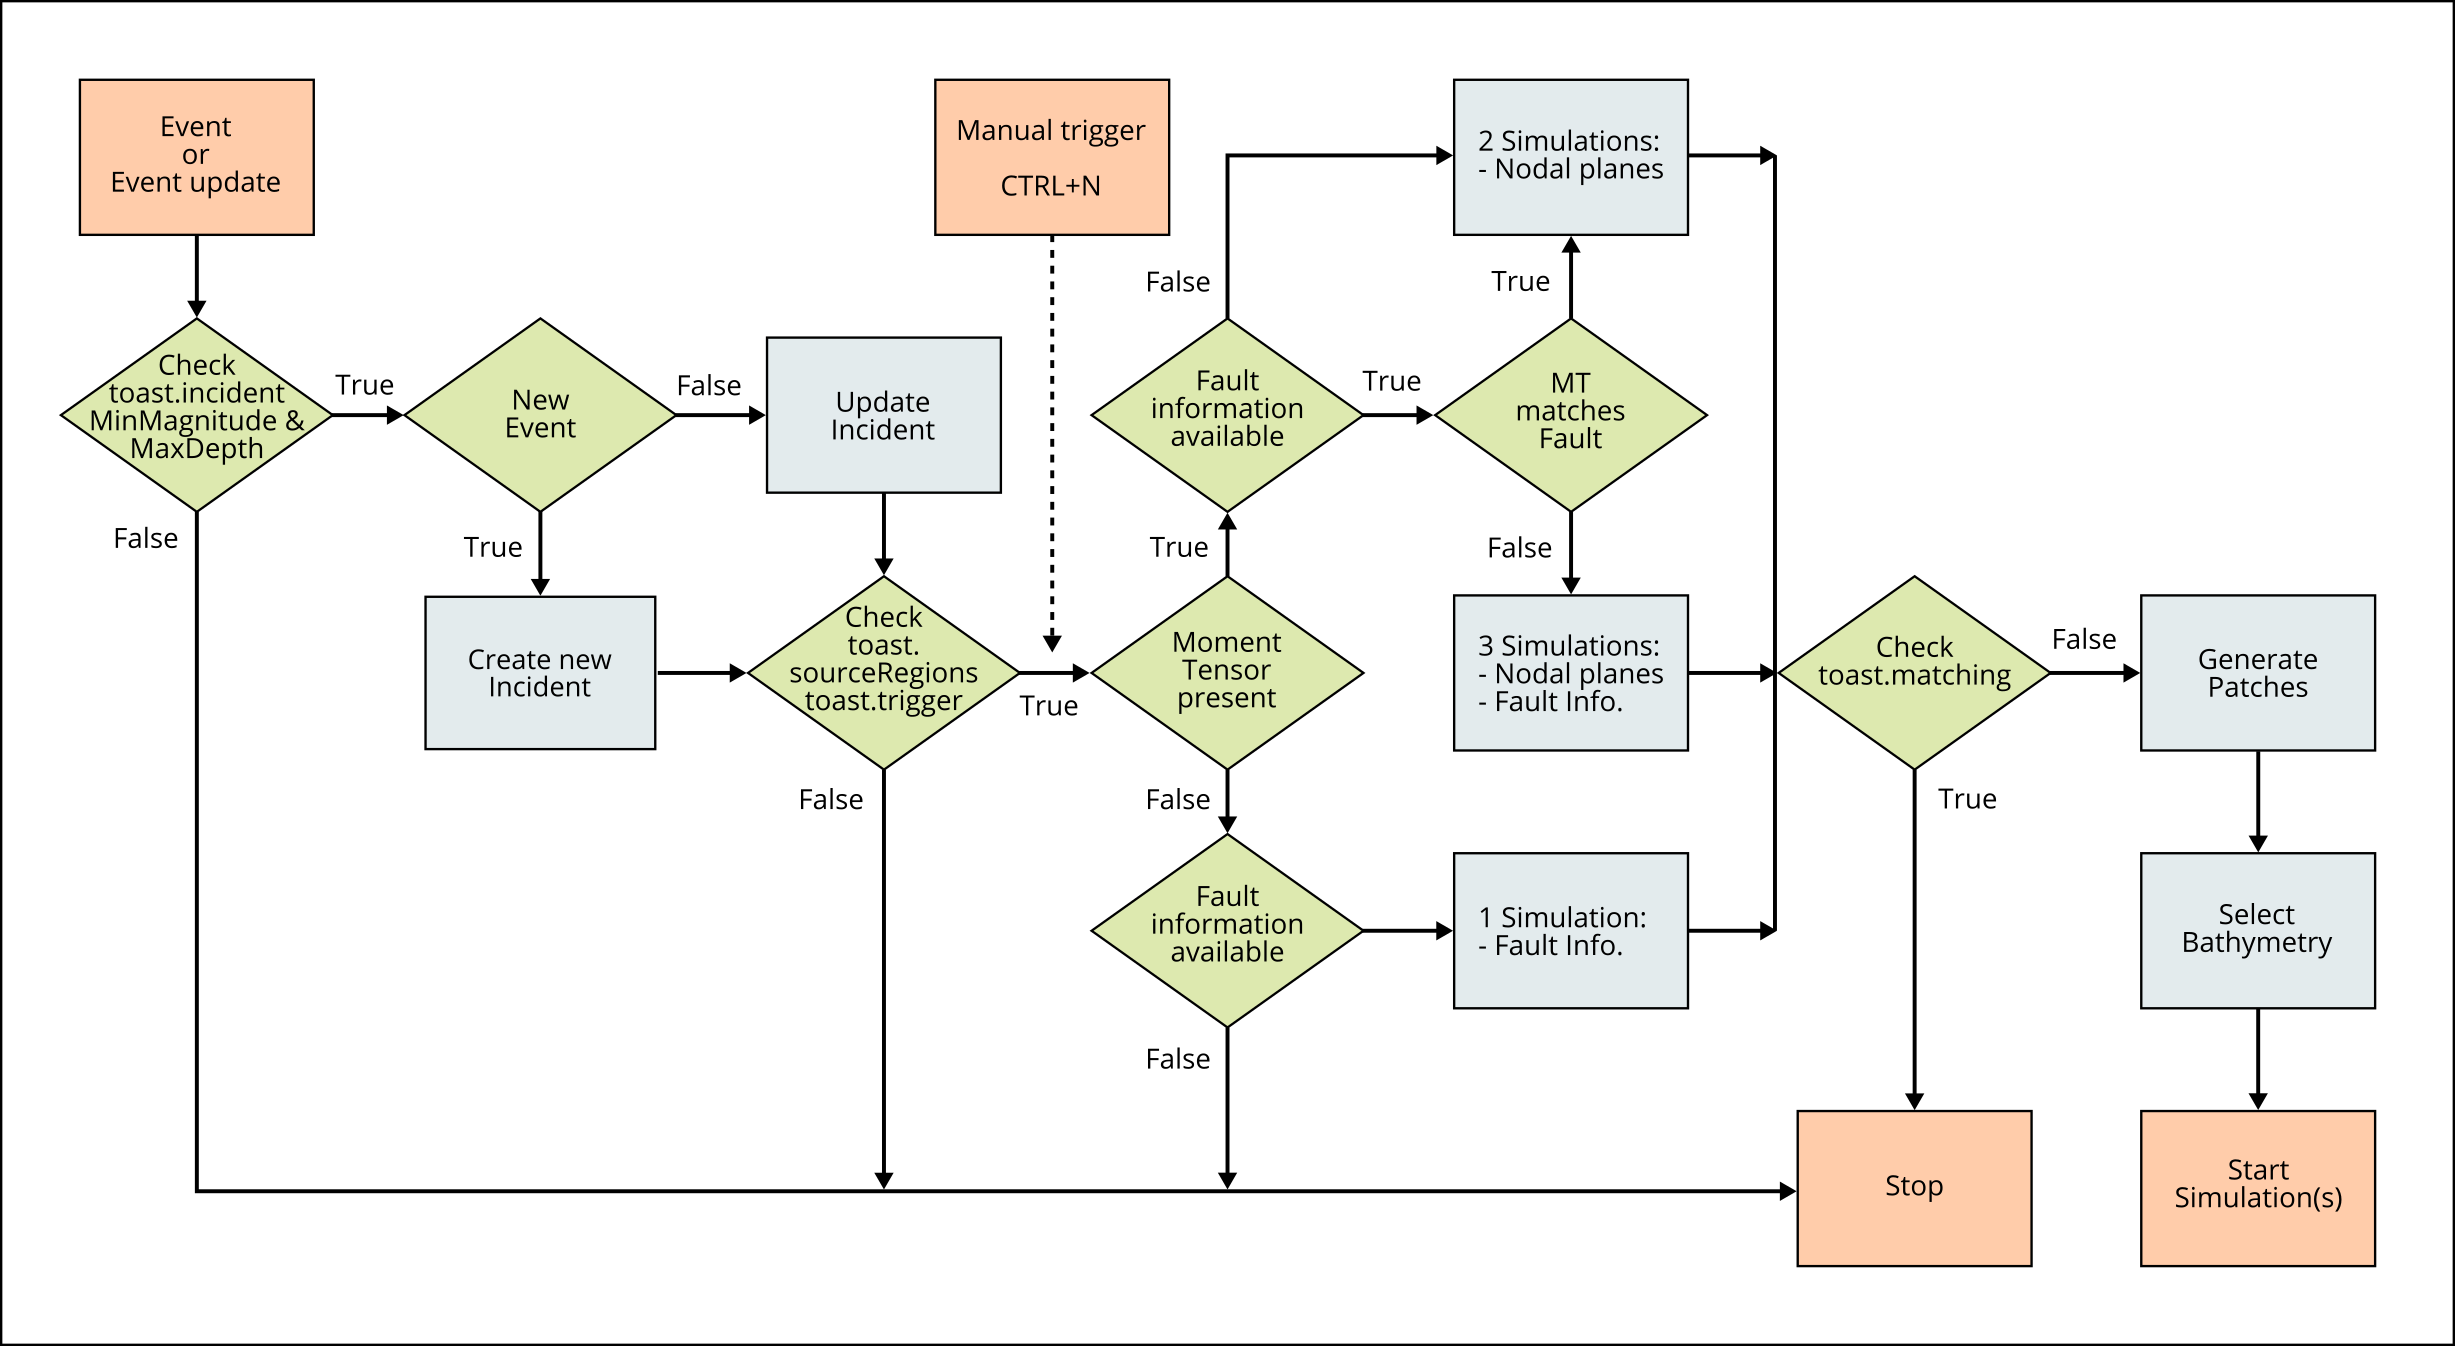
Flowchart for the automatic generation of simulations
First, it is checked whether the earthquake magnitude is larger than
incidentMinimumMagnitude
and whether the earthquake depth is shallower than
incidentMaximumDepth.
If a new event was received, then a new incident is created,
if an event update was received, the incident is updated.
Next, following settings are checked:
sourceRegionsSee also: Source regions configuration.
Then, depending on availability of a Moment Tensor (MT) solution and the configured faults, either 1, 2 or 3 simulations are proposed. 3 simulations are proposed if the normalized minimum rotation angle (see also: Kagan angle) between the model from the configured faults and the 2 models corresponding to the nodal planes of the MT solution is larger than 0.7, otherwise it is assumed that the 2 solutions from the MT are sufficient.
The simulations are finally started after checking that no similar simulations are already present according to the criteria defined in:
Enable processAutoMT to use automatically generated moment tensors
and set the mode of the origin (manual, automatic or both) in
trigger.origin.mode.
As input, simulations use default values, which can be configured using: scconfig : Consult hovertips in scconfig for more information.
By default, easywave2.patches.strikeAlign and
easywave2.patches.dipAlign are set to 0.5, which means that the
generated patches are centered around the epicenter. They can be set to a list,
for example: 0,0.5,1, which means that additional 2 simulations are generated,
shifted by half length (or width).
Note
The number of simulations that are generated according to:
Flowchart for the automatic generation of simulations is multiplied by the number of registered automatic
Simulation Profiles and by the length of
easywave2.patches.strikeAlign and
easywave2.patches.dipAlign.
In case no moment tensor and fault information is available or if the automatic patch generation doesn’t deliver optimal results, the simulation dialog can be used to initiate a simulation interactively (see: Create simulations interactively).
Simulation Profiles
Automatic simulation generation produces results based on default parameters.
Multiple simulation profiles can be added and used.
All available profiles are listed in after
definition and registration in easywave2.profiles.
Each simulation profile is executed when triggering the automatic simulations (if automatic is set in the profile). Note that the same thresholds and filters are applied as mentioned in Automatic Simulation and Configuration. If a profile is configured to start automatically, the default automatic simulation is not triggered.
Start simulations for events imported from database
If an event is not received by messaging but imported from the database by the user, simulations are not triggered automatically. But they can be initiated using CTRL+N. In this case the processing starts at the point as indicated in Flowchart for the automatic generation of simulations.
Create simulations interactively
In order to add simulations manually to an incident, open the Simulation Dialog via: or with Ctrl+Shift+N.
The dialog opens with a set of predefined settings for the earthquake model and its geometry as well as for the simulation backend to be used. See Rupture settings and Simulation backend settings for a description.
After adjusting the settings, click Generate patches for automatic, or Draw patches for manual patch creation. Click Start to compute the simulation. During computation, the progress is indicated in the database panel. Double click the simulation to turn it active (also possible during computation).
Rupture settings
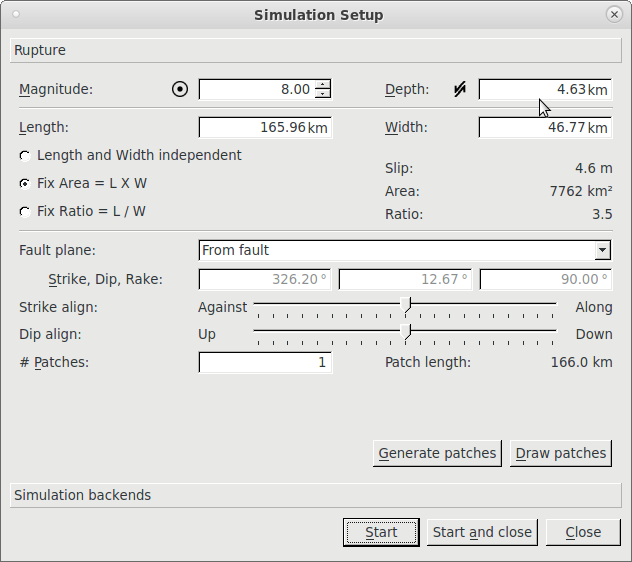
Simulation setup - Rupture
Magnitude: Adjust or use the value of the event or focal mechanism (by clicking the icon on the left)
Depth: Use value from event, fault geometry, focal mechanism (by clicking icon on the left) or enter value.
Length, Width: Default values are computed using scaling relations by Wells & Coppersmith (1994). If you manually change one of the two, the behavior of the other one and of the resulting slip depends on the selection below
[L]ength and [W]idth independent: Manual modification of L or W is compensated by adjusting [S]lip (L x W x S remains constant for given magnitude)
Fix Area: Change of L is automatically compensated by change of W and vice versa
Fix Ratio: Change of L results in change of W and adjustment of S (and vice versa)
Fault plane:
From fault: Strike, dip and rake are interpolated automatically from the predefined Fault geometry configuration.
Strike from fault: Set dip and rake values manually.
Manual: Set all values manually.
Strike and Dip align: By default, the automatically generated fault patches are centered around the epicenter. Use the sliders to shift the patches along strike and dip direction up to half total length and width.
# Patches: The number of patches to be generated or drawn. Corresponding patch length is shown below.
Generate patches automatically
Click Generate patches to use above settings for the automatic generation of the rupture patches of the earthquake fault model.
Draw patches manually
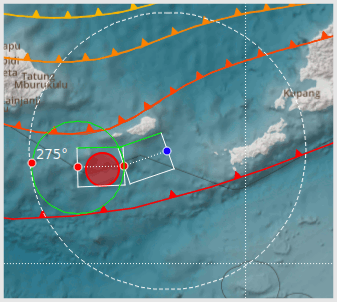
Simulation setup - Draw patches manually
Click Draw patches to enter the location and strike direction of the rupture patches manually. Other settings are according to the values in the dialog. Use left mouse click to add patches one by one up to the defined number of patches. While drawing, the white circle has as radius total rupture length and the green circle has as radius patch length.
Dipping of the patches is always to the right side. For example, if the starting point is in the South and the end point is in the North, the dipping direction is East. It can be changed during drawing by SHIFT+mouse clicking on the end point of a patch (only if more than 1 patch in total).
Note
Make sure that the green edge, which corresponds to the lower edge of the patches, is in accordance with to the local tectonic setting (e.g. compare to configured faults).
Simulation backend settings
The Simulations tab is used to select and configure the plugin which is used as simulation backend.
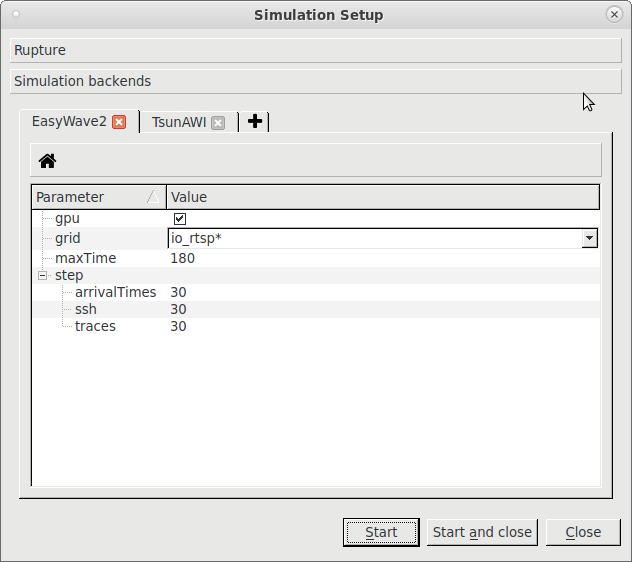
Simulation setup - Simulations
The standard plugin which is delivered with TOAST is EasyWave2. The settings are:
step
sshMax: Simulation time step in min for the output of the sshMax grid during computation (same file is overwritten).
ssh: Simulation time step in min for the output of ssh grids (new file for every time step).
poi: Simulation time step in seconds for the output of time series.
arrival times: Simulation time step for the output of the arrival grid during computation (same file is overwritten).
maxTime: Total duration of the simulation in minutes.
grid: Select the bathymetry which is used for the simulation, see also: Simulation bathymetry files configuration. The green rectangle in Map perspective corresponds to the borders of the selected bathymetry.
gpu: Select if the simulation is computed using GPU. See: toast_gpu.
Click on the + tab to add another plugin configuration. For instance for TsunAWI, you can set the values for Azimuth and Magnitude uncertainty.
Note
EasyWave does not compute tides, this is why in the Waveform picker the Tsunami waveform filter should be applied to observations for comparison.
Display simulation results
The results of the active simulations(s) are used in various perspectives, like the Map-, Arrivals- and Forecast Zones perspective as well as the Live Tabs.
Use the Map Layers panel, under Wave propagation, to enable the display of simulation results in the Map perspective and the Wave Propagation panel.
Select ‘Legends’ to turn on legend color bars in Map perspective.
See also: Create and modify color profiles.
Arrival lines
Show the propagation of the tsunami wave after event time as contour lines. Solid lines have one hour interval and are labeled. Dashed lines are half-hour intervals in-between.
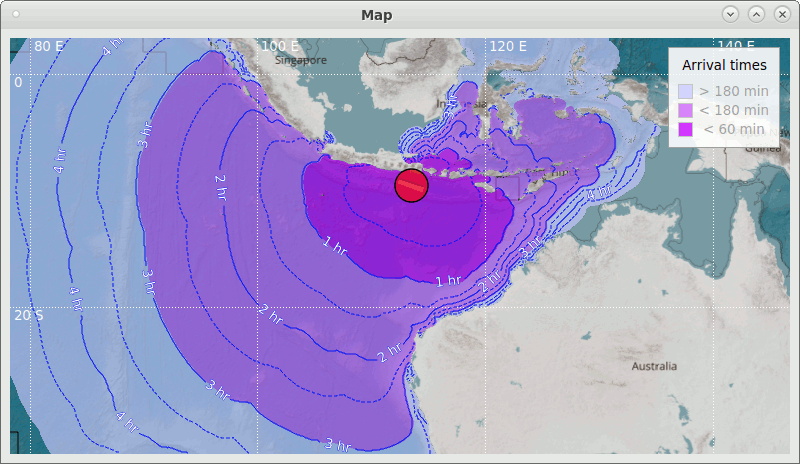
Map perspective with Arrival lines and times features selected
Arrival times
Display the arrival of the tsunami wave as color coded areas see figure above). By default, arrival within 1 hour is red, between 1 and 3 hours is orange, and between 3 and 6 hours is yellow (see legend).
Bathymetry
Turns on display of the Ocean model which was used for the simulation (currently only for binary grids for EasyWave). This can be very useful for instance if results in small harbors are not as expected, as the bathymetry and topography used for the simulations depends on resolution and is not identical to the one shown as map background. Use right mouse click -> Filter -> Nearest on the map to switch off interpolation and get a sharper image.
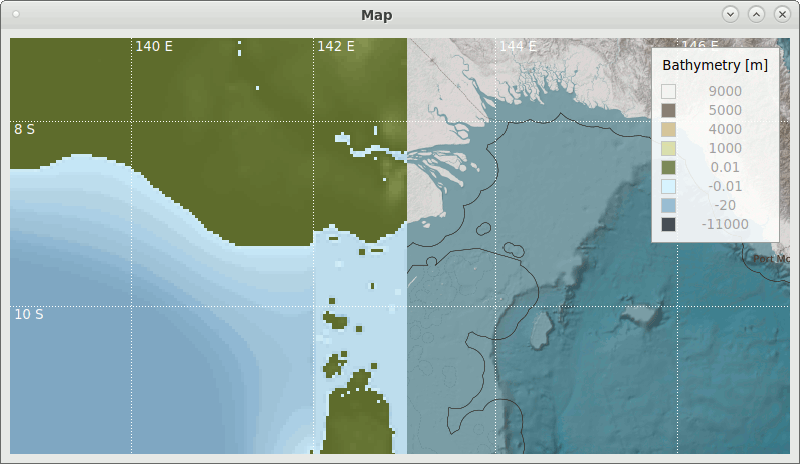
Left: bathymetry used for simulation, right: map background.
Isochrones
Show the extent of the tsunami at a certain time as red line. Use the Simulation player to select the time.
SSH
Display wave height according to active simulations at certain time. Use the Simulation player to select the time.
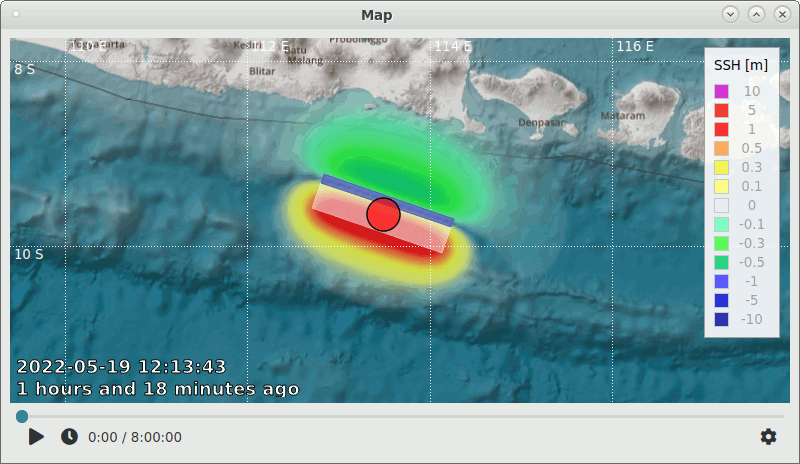
Map perspective with SSH feature selected, at time zero (initial sea floor deformation)
SSH max
Display maximum wave height according to active simulations. It is updated while a simulation is being computed.
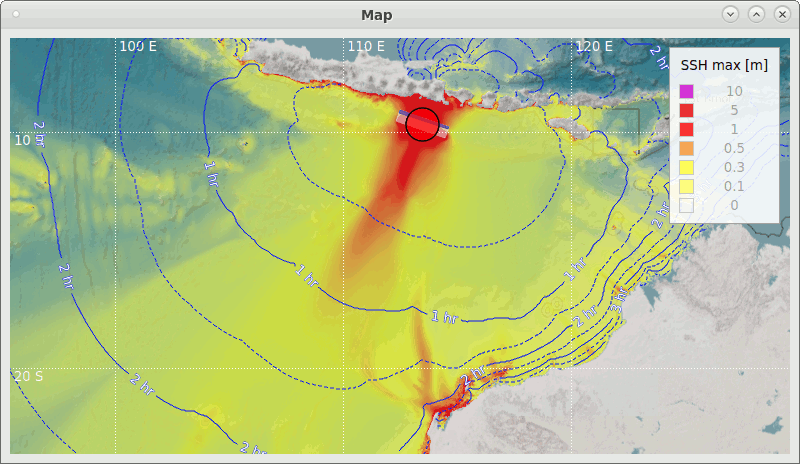
Map perspective with SSH max feature selected