TOAST documentation
This is the documentation for TOAST version 2026.189#bd354fc90.
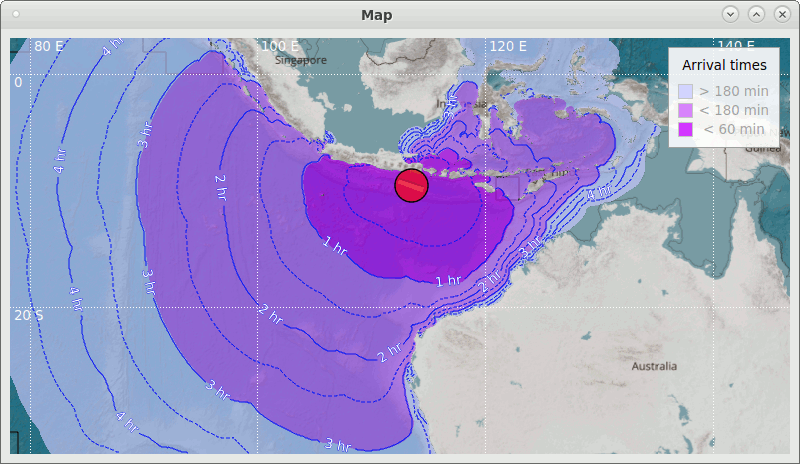
Arrival isolines on maps visualize the tsunami propagation.
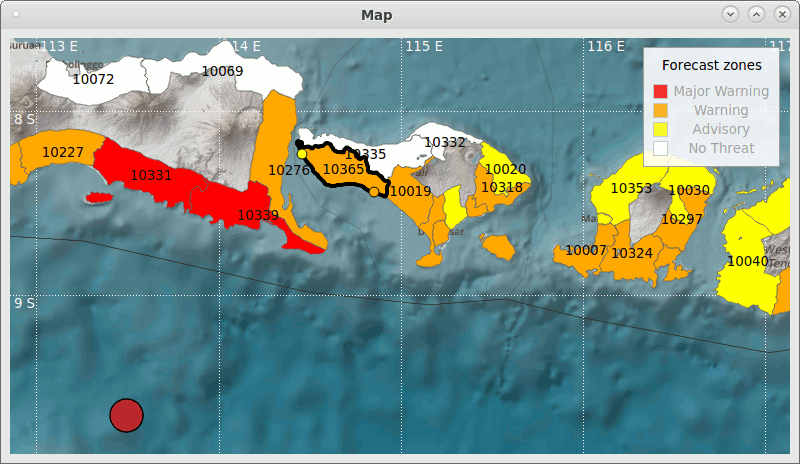
Maps with forecast zones show the threat levels.
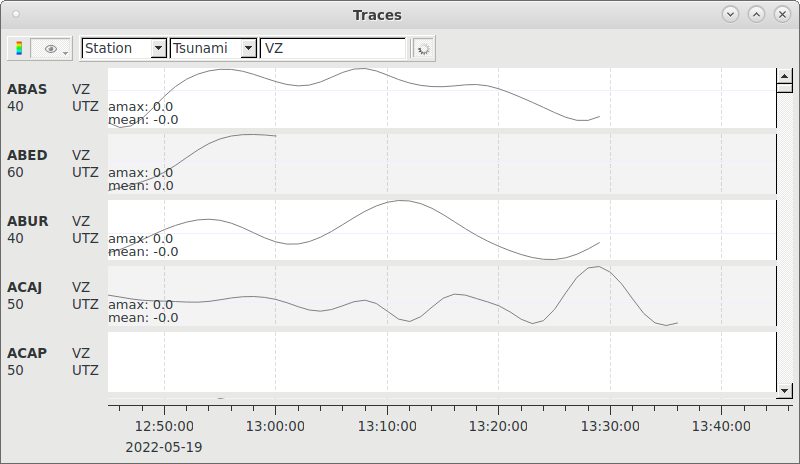
Real-time waveforms provide instantaneous sea-level information and comparison to simulations.
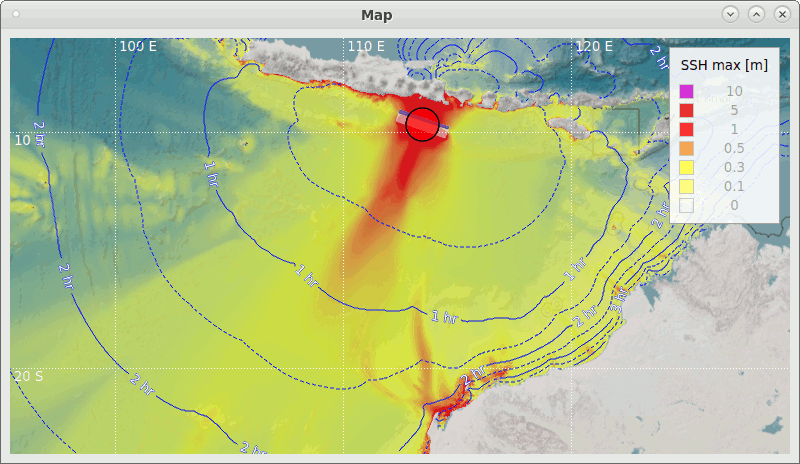
Maps show the maximum wave height across the ocean.
Features and Concepts
Installation and Configuration
- Installation
- Configuration
- Module configuration
- Example configuration files
- Inventory and Bindings
- Fault geometry configuration
- Forecast zones configuration
- Threat level mapping configuration
- Simulation bathymetry
- Simulation profiles
- Bulletins, templates and Live tabs configuration
- Templates configuration
- Template variables configuration
- Live tabs configuration
- Color profiles and gradients configuration
- TOAST configuration parameters
Interactive Analysis
- Graphical User Interface
- Simulations