Examples and Recipes
Interactive Stream Selection
Each tab allows interactive configurations which are valid during runtime of VORTEX.
Map tab
Selection of stations for viewing in the Overview and the Detail tab or for viewing station details at the right edge of the Map tab:
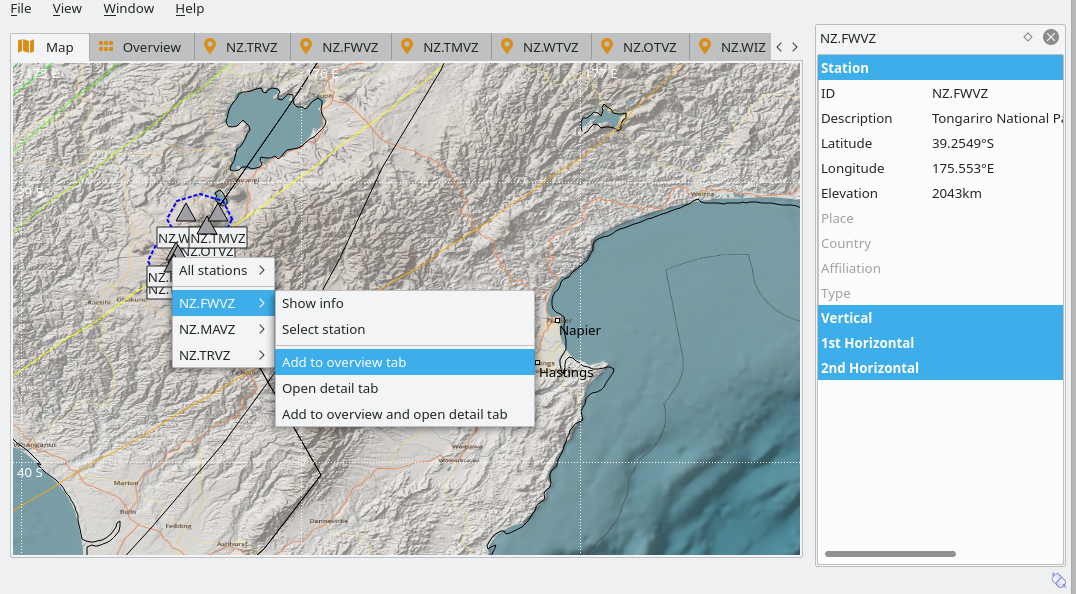
Figure 1: Map tab for selecting stations with station details.
Overview tab
In the Overview tab the data type, the channels and the offset mode of the viewed data as well as color scheme for the spectrograms (SSAM) can be adjusted. Make the selection from the drop-down menus or drag the markers of the color scale. Double-click on one station widget to switch to the Details tab.
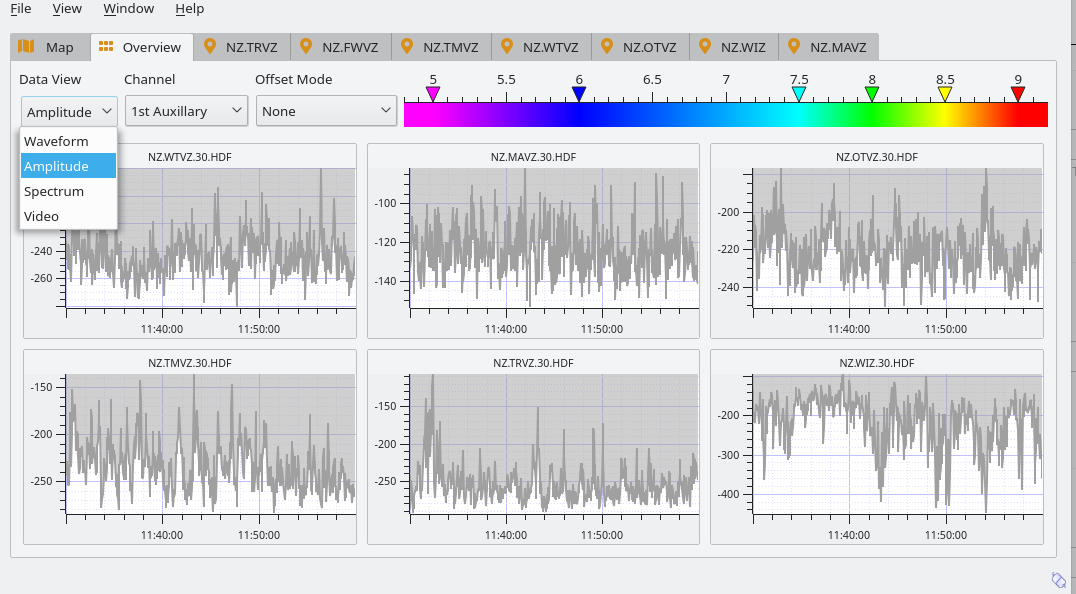
Figure 2: Overview tab for selecting data type, channels and offset mode. Currently selected is Amplitude (RSAM).
Details tab
In the Details tab all data to view can be selected in the selection box at the right edge of the tab. The data selection includes the defined primary and auxiliary streams as well as the camera video. Typically, primary and auxiliary streams are seismic waveforms and other data from sensors, respectively. Stations only visible in the Details tab can be added to the Overview tab by clicking on “Add to Matrix”.
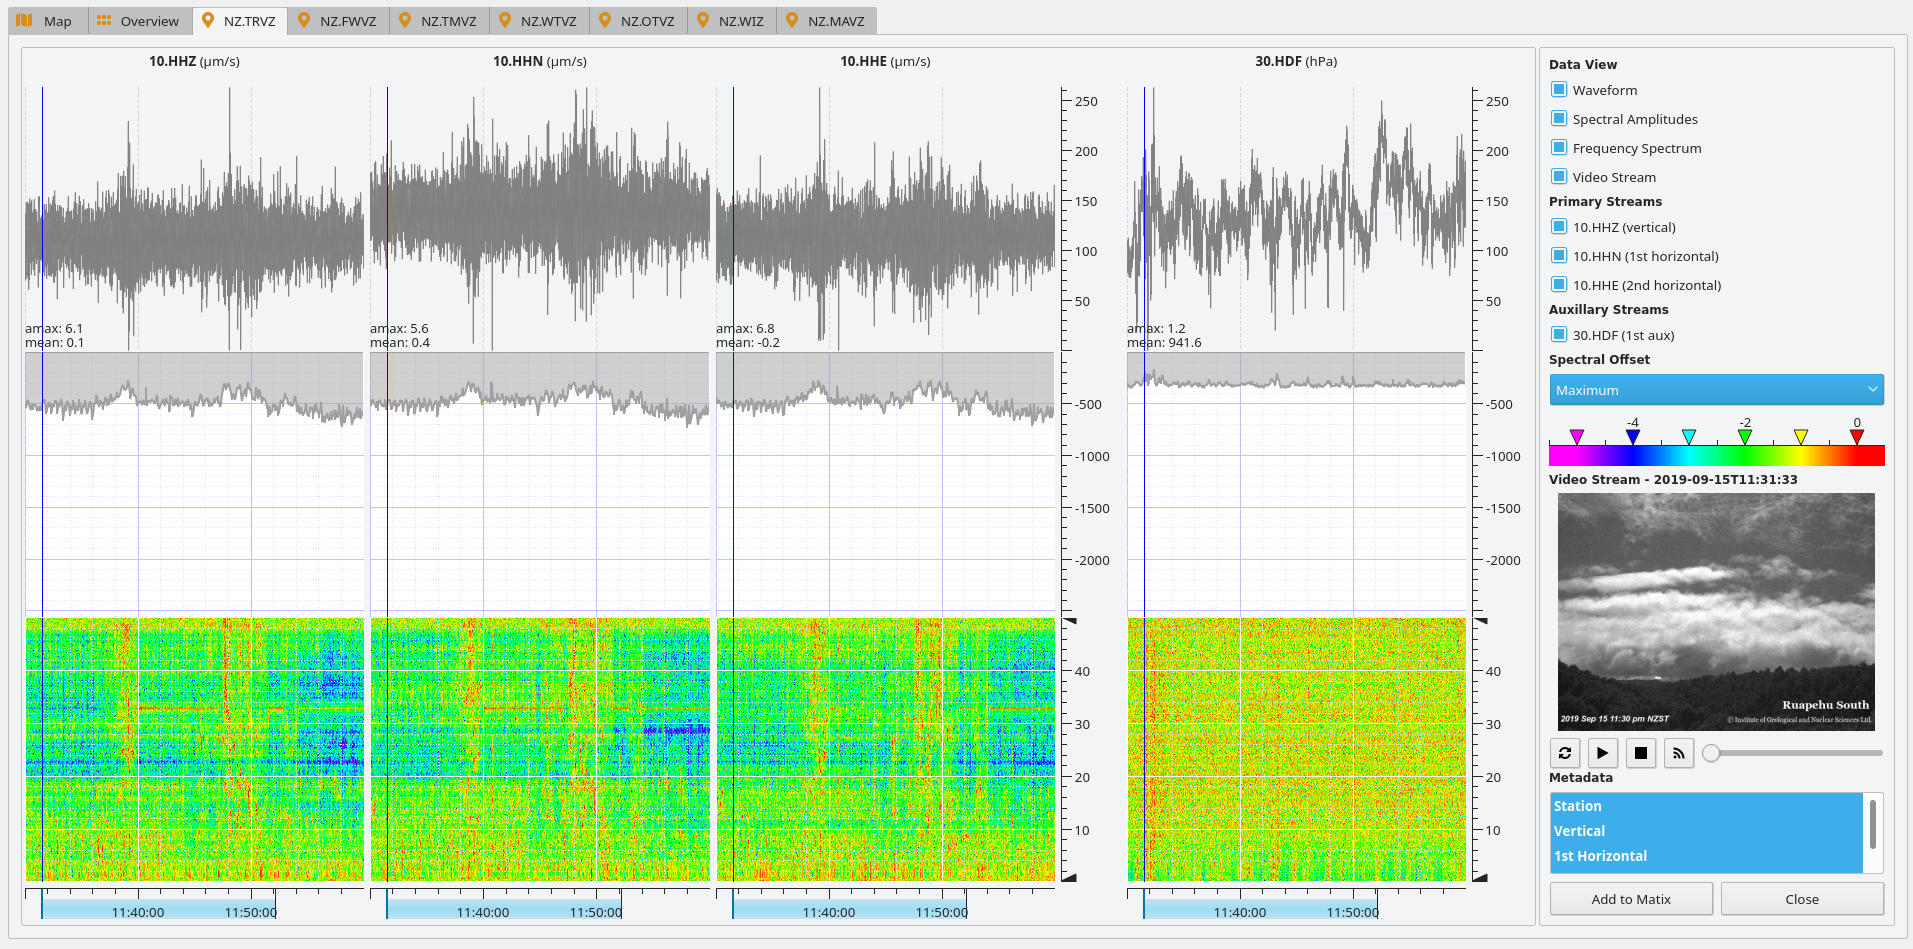
Figure 3: Details tab for selecting the data to view.
Artificial origins
Signals can be interactively detected in the Station or the Overview tab. Create
an artificial origin in VORTEX to process the signal in other interactive GUIs
such as scolv scolv [3]. Make sure, the
commands.target parameter is
configured.
Procedure:
Identify an event or another relevant signal in any of the widgets in the station tab.
Use the middle mouse button to click on the signal. The artificial origin dialog allows to modify the source parameters. The initial values are the location of the sensor and the selected time.
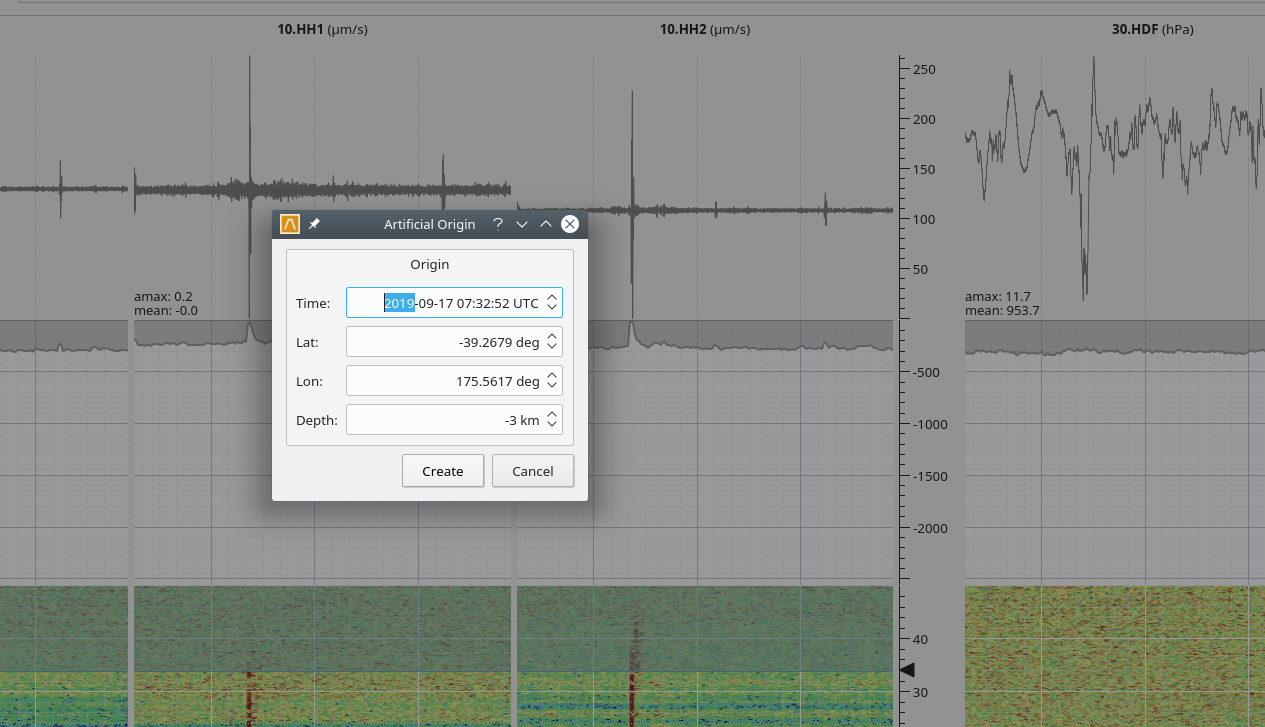
Figure 4: Detail tab with artificial origin.
Note
Signals can also be selected in the Overview tab: Middle-click on the signal switches to the Detail tab where the artificial origin can be created.
Interactive filtering
Interactive filtering of signals is possible in the Detail tab of VORTEX by adjusting the frequency window in the spectrograms:
Drag the lower triangular marker of at the vertical frequency axis of the spectrogram to adjust the lower frequency limit
Drag the upper triangular marker of at the vertical frequency axis of the spectrogram to adjust the upper frequency limit
The filter will be immediately applied to all signal of the same type.
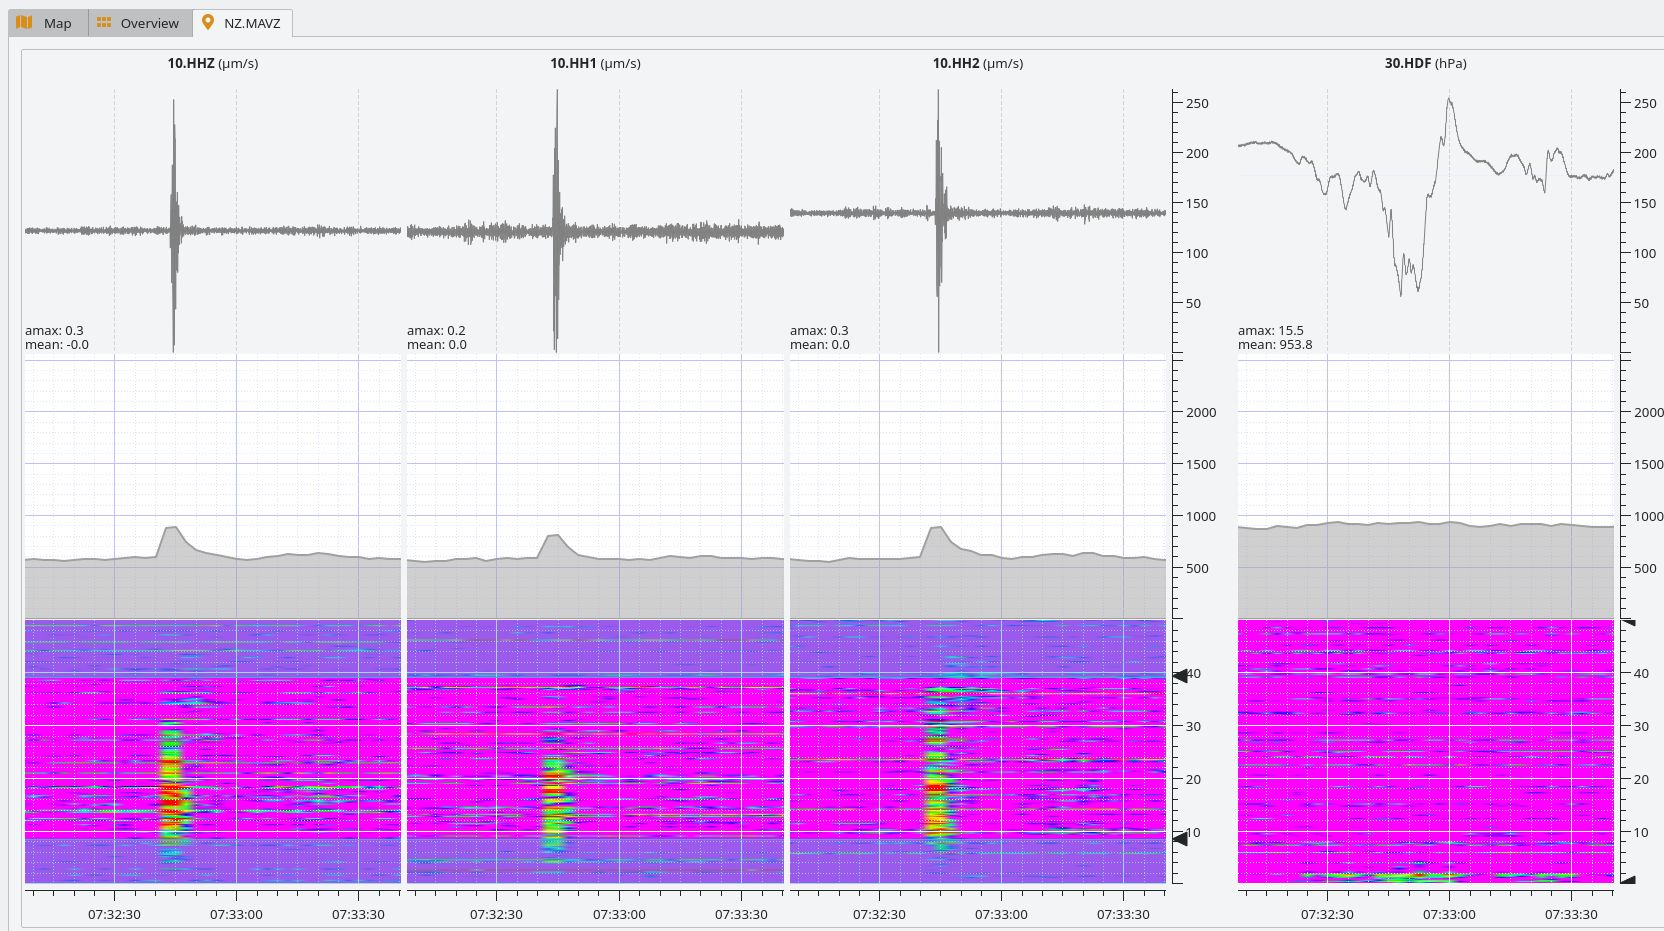
Figure 5: Detail tab with filtered waveforms.
Time window processing
Instead of processing real-time data, data can also be analyzed for specfic time windows.
The configuration parameters :confval`endTime`: and bufferSize control
the end and the duration of the time window, respectively. Adjust the parameters
in the VORTEX module configuration or during command line call, e.g.:
vortex --endTime='2019-09-15 12:00:00' --bufferSize=3600
will load 1 hour of data ending at GMT noon time on 15 September 2019.