Introduction
VORTEX is multi-sensor, multi-station volcano monitoring module combining seismic waveform data with camera images and other sensors such as pressure, temperature and geochemistry. The stations and sensors can be selected from a map. Raw and processed data from different sensors and event sensor types can be analyzed side-by-side.
VORTEX combines some of the most useful techniques of volcano monitoring like RSAM and SSAM.
RSAM, Real-time Seismic-Amplitude Measurement, represents the overall signal size over periods of 10 minutes. In situations when the number of earthquakes is so high that individual earthquakes can’t be seen, or the level of volcanic tremor is such that seismograms no longer show a change in signal level, then RSAM is an excellent way of showing changes with time.
SSAM, Seismic Spectral-Amplitude Measurement, shows the relative signal size in different frequency bands. Using SSAM it is possible to get an idea of whether a signal is produced by earthquakes, by wind or traffic noise, or by volcanic tremor. Earthquakes, wind and traffic noise all tend to have energy at a wide range of frequencies (a wide-band signal), while volcanic tremor tends to have energy in a more limited range of frequencies (a narrow-band signal).
In addition to these 2 techniques VORTEX integrates also other sensor data like video data to provide a more complete picture of the ongoing situation.
Note
While time series can be received in miniSEED format from sources which are standard in SeisComP such as seedlink [4] and FDSNWS [2] the processing of other non-miniSEED data such as video streams may require the connection to the CAPS server [1]. The CAPS server [1] is provided by another gempa package and can be purchased independent of VORTEX.
Features
VORTEX provides data processing and visualization methods for real-time volcano monitoring:
Overview over the current and past state of one or more volcanos simultaneously
Simultaneous multi-sensor analysis
Simultaneous multi-station analysis
Camera supervision complementing data analysis
Interactive detection and analysis of volcanic seismic events assisted by user-friendly, flexible graphical user interfaces (GUIs)
On-the-fly GUI re-configuration during runtime
VORTEX provides an interactive GUI that has different tabs which are configurable:
Map tab showing station locations on a map
Overview tab showing the data from multiple stations
Details tab showing the detailed data for one station allowing to detect volcanic events interactively.
Event tab load and filter events from your databse into the system. Run custom scripts.
The data are provided in widgets that can be re-arranged during runtime.
Architecture
VORTEX is connected to a SeisComP system to fetch the station meta data and to a server to receive the real-time data from all configured stations and multiple sensor types. For data in other than miniSEED format the connection to a CAPS server [1] is required.
Map tab
One or more stations can be selected interactively from a map for viewing the data in the Overview and the Details tabs:
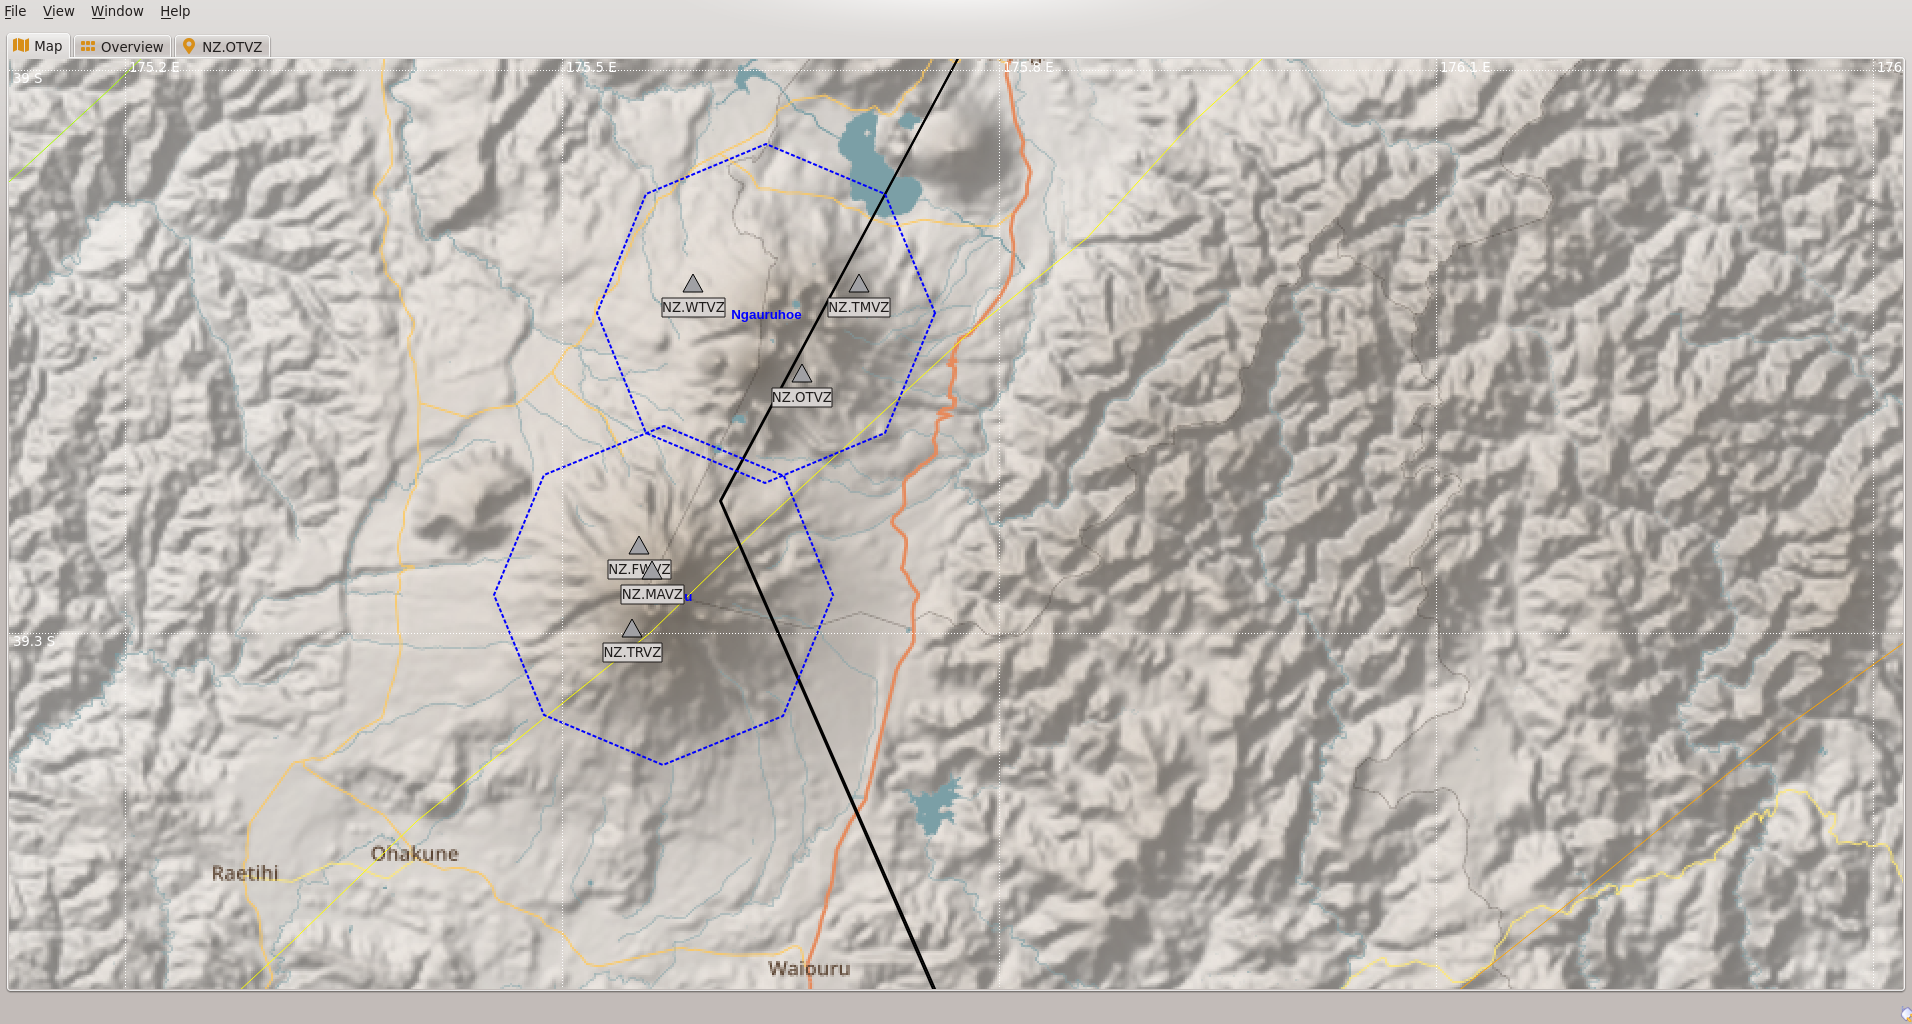
Figure 39: VORTEX Map tab for selecting sensor stations.
Right-clicking on a station on the map tab allows to add the data to the Overview and the Details tabs.
Overview tab
The stations shown in the Overview tab are selected from the map tab. In the overview tab, the same component of all stations can be viewed side-by-side. Raw or processed data can be viewed, including:
Raw waveforms from different components
Processed waveforms
Camera data
Select the data type and the component by clicking on Data View and Channel, respectively. Waveforms can be normalized in different ways to enhance the signal visibility. Click on Offset Mode to make the selection
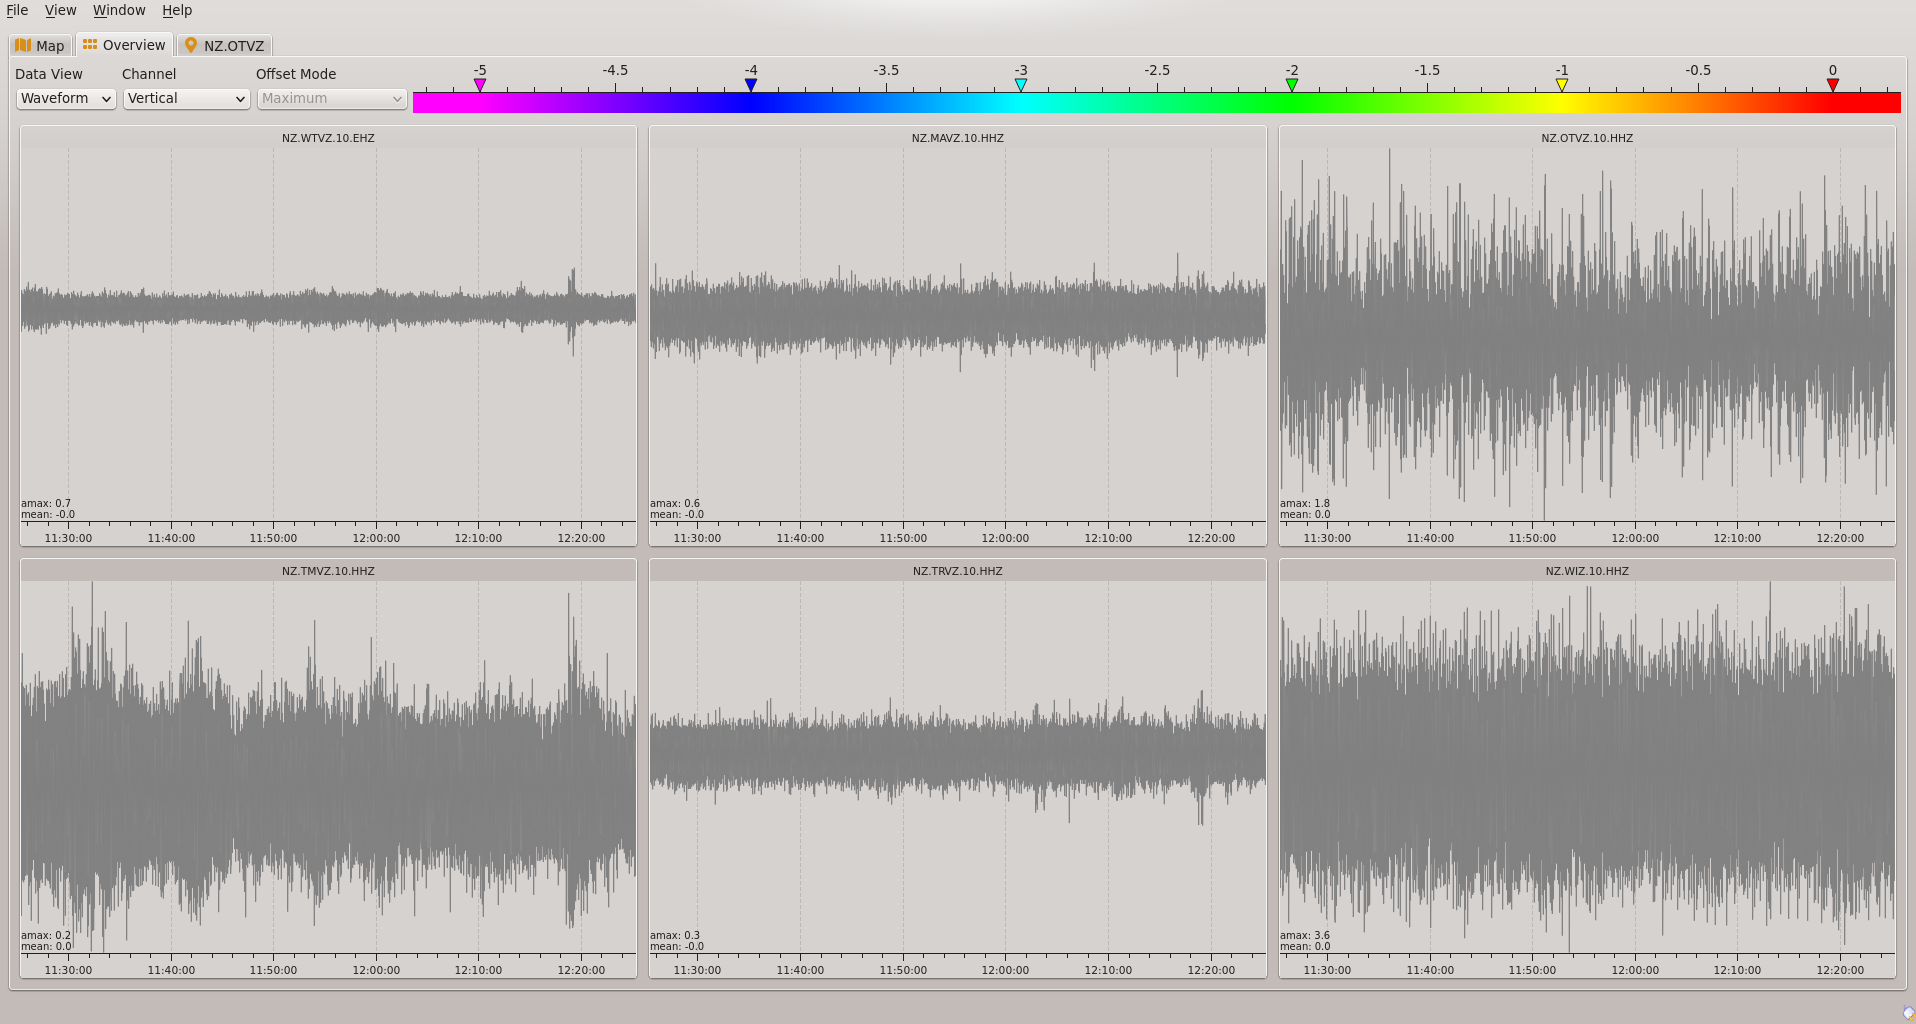
Figure 40: VORTEX Overview tab for selecting sensor components, raw or processed data and color scaling.
The layout of the data widget matrix is controlled by configuration and can be adjusted during runtime.
Details tab
The Details tab allows to view the raw and processed data from multiple components and different sensors of the same station simultaneously. E.g. in this tab the seismic data may be compared with auxiliary streams such as pressure data and live images of a camera to interpret the data. The Details tab also allows to create artificial origins for identified events which can be processed in other GUIs.
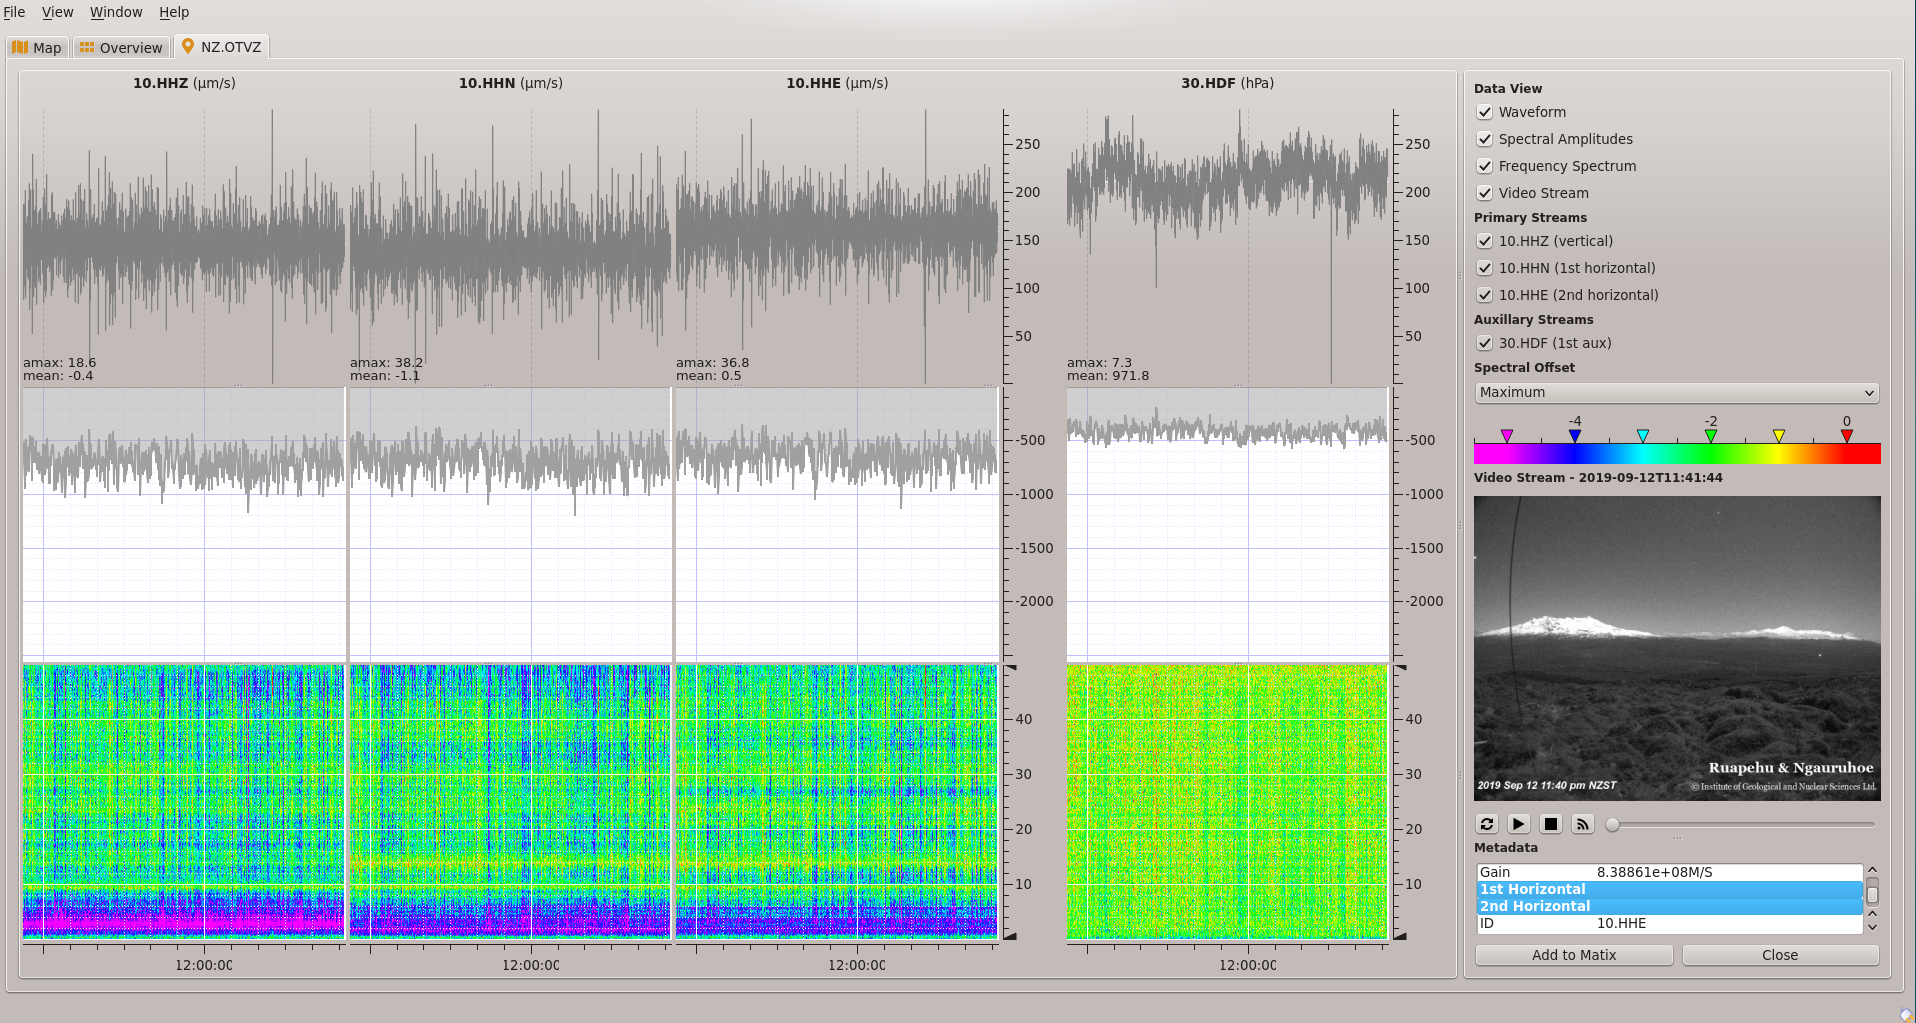
Figure 41: VORTEX Details tab for viewing raw or processed data from multiple sensors of the same station side-by-side.
The display of the data can be adjusted during runtime.
Events Tab
The Events tab allows to load events from the database. These events can then be filtered by depth, magnitude, location, etc. The list of events can be imported to the vortex session, by clicking the map symbol. After that, the events are visible on the map and can be selected there or from a dropdown- menu in the overview tab. Furthermore it is possible to run custom Python scripts for tailored plotting of event parameters. These scripts take the event list as input for generate HTML code which is evaluated and displayed in separated tabs. A template Python script is provided. This tool can be easily adapted for visualizing or analysing a variety of aspects. Displaying data with these custom plot scripts can be interactively updated during runtime.
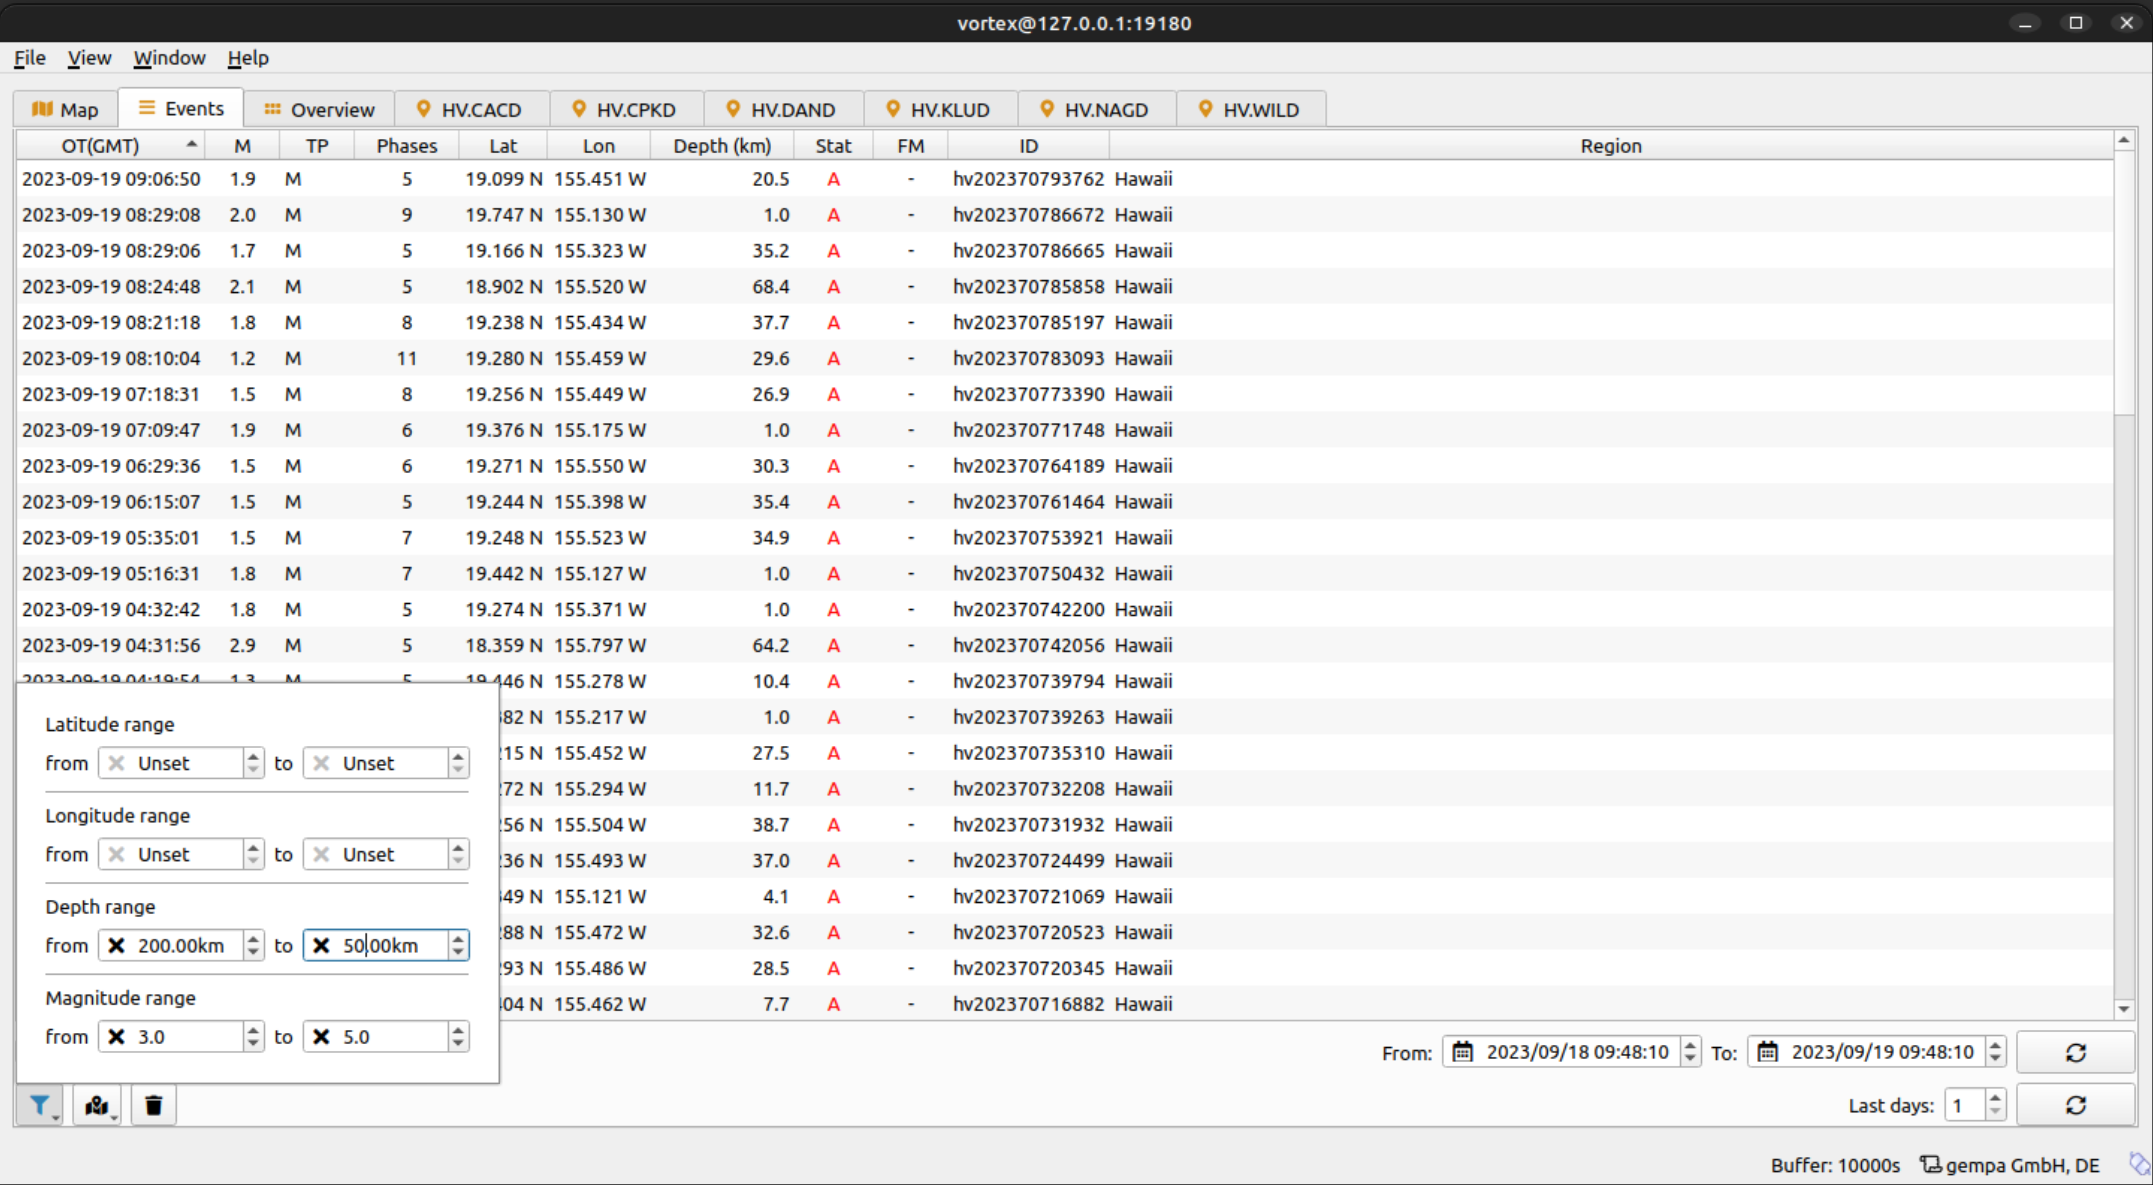
Figure 42: VORTEX Events tab for loading and filtering events and running custom scripts.
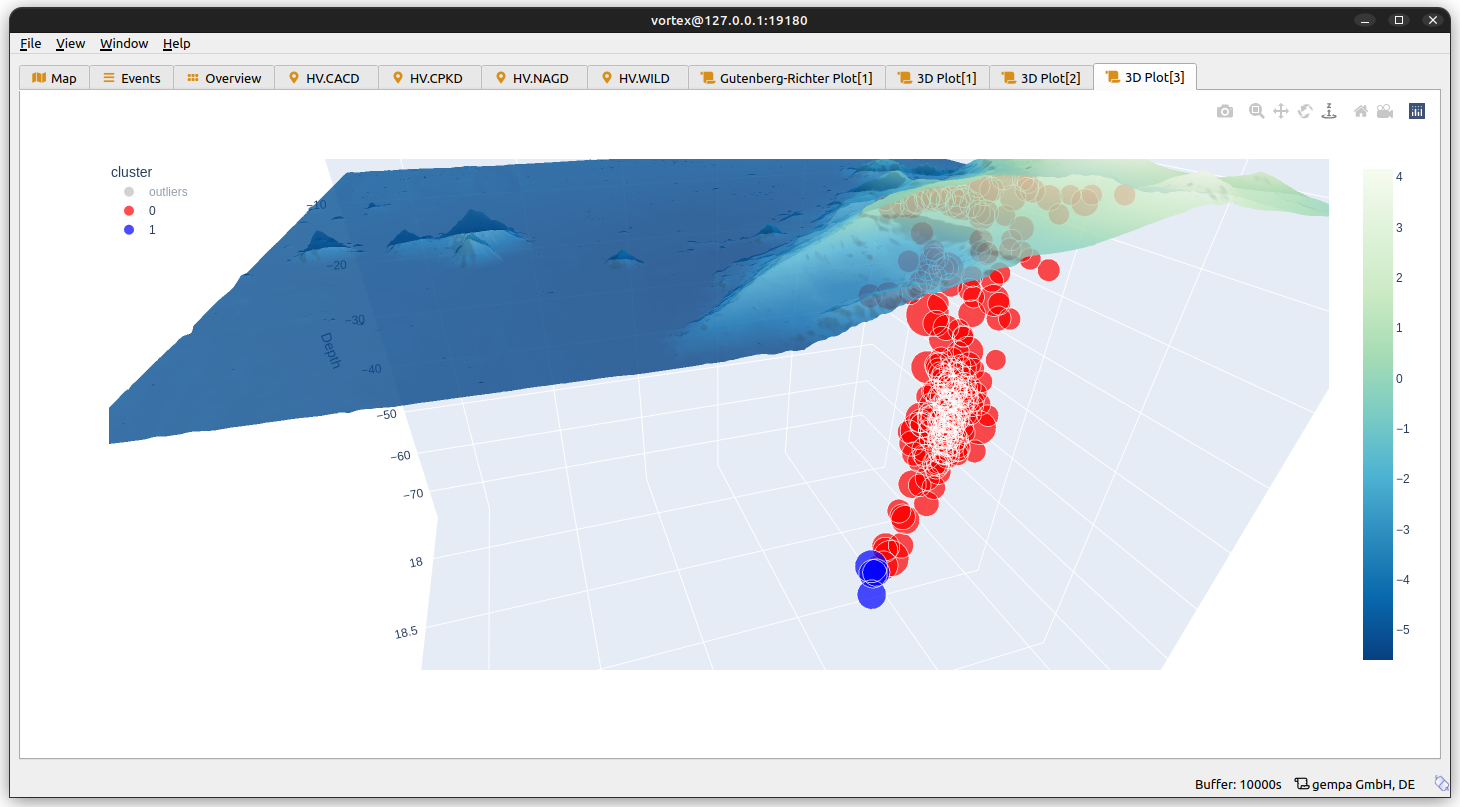
Figure 43: 3D plot of earthquake hypocenters. Here, the events trace the magma conduit of a volcano on Hawaii down to 70 km depth.
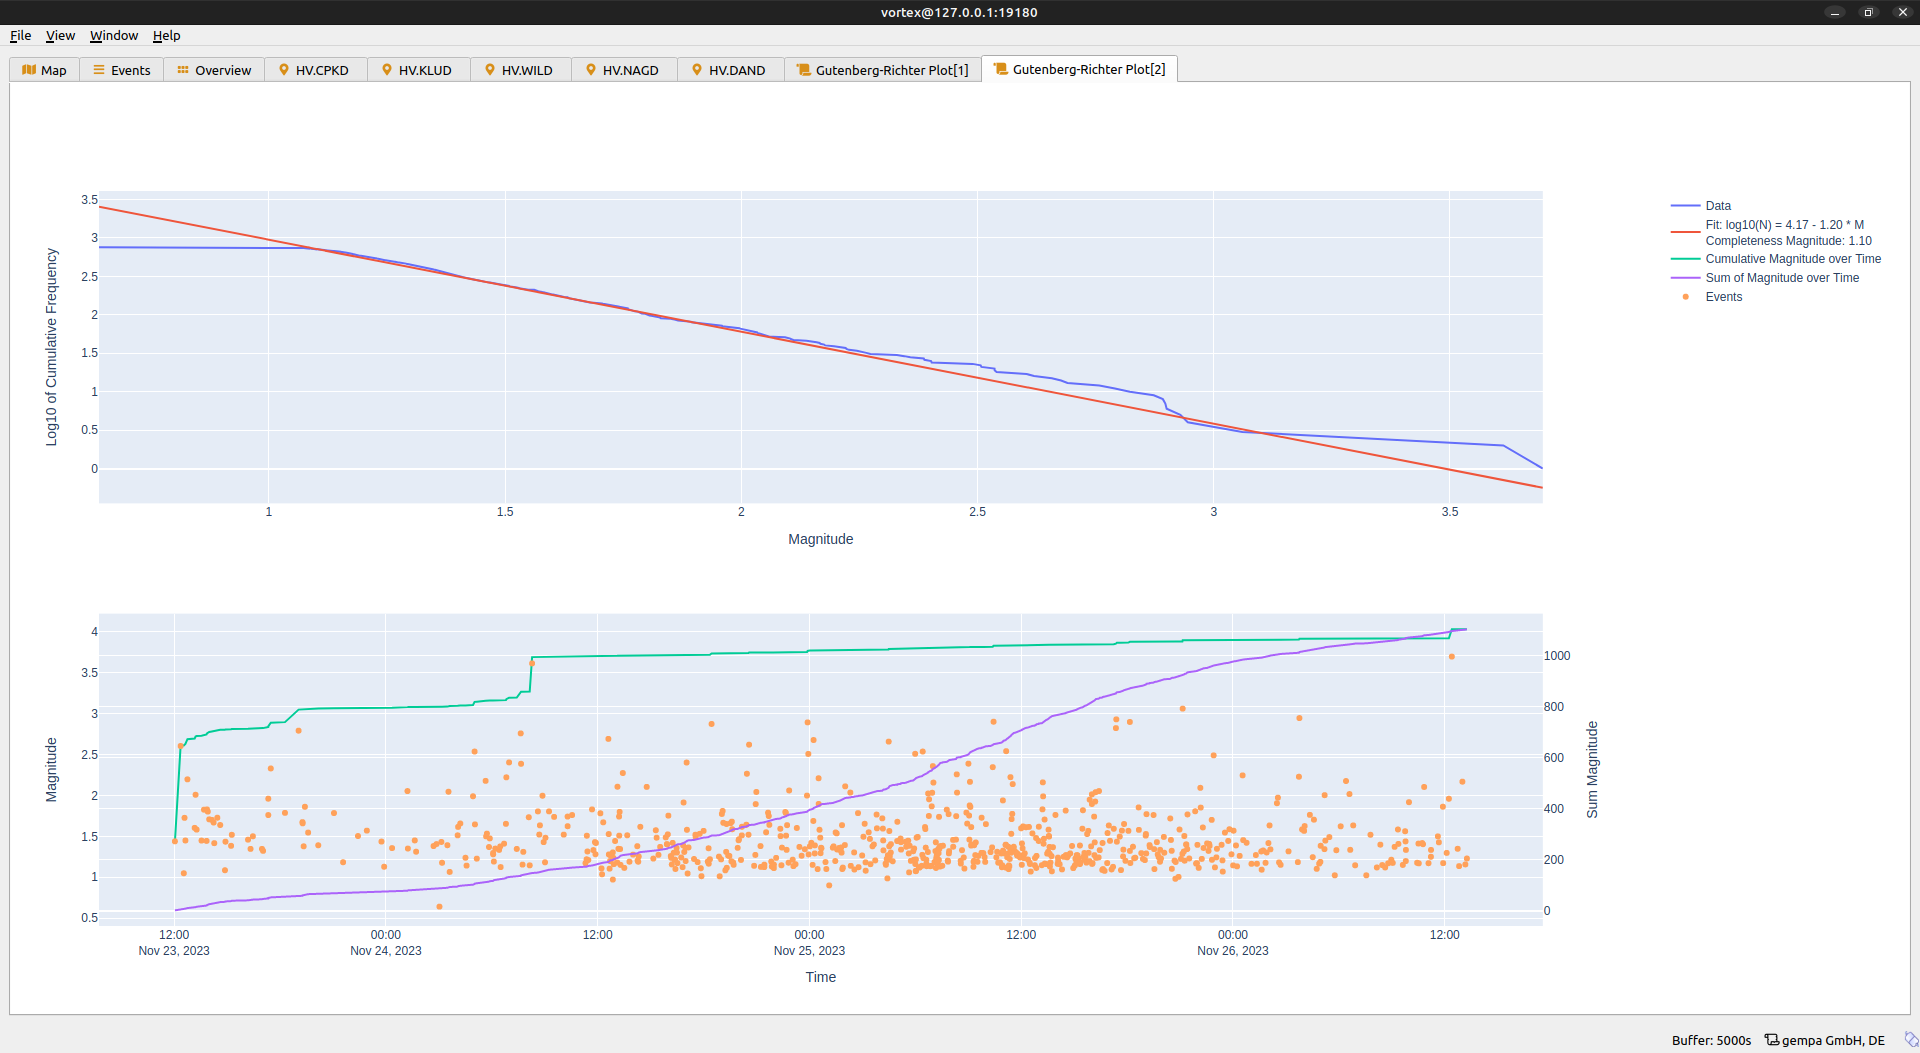
Figure 44: Gutenberg-Richter and seismicity plots for the events shown in the 3D plot above.