Create warning bulletins and other output using templates
Bulletin templates
TOAST provides the possibility for creating and disseminating tsunami bulletins whose content is based on data related to an incident (like earthquake origin), to one or several simulations (like forecast zones warning level) and observations (like tide gauge or GNSS). Bulletins are generated using so-called templates.
A template is a blueprint for a bulletin. But it can also be used to generate other kind of output like a tsunami simulation video. The template technology is based on ClearSilver. All variables and functions in a template are evaluated by the TOAST GUI in order to create and render the bulletin.
Various output formats are possible, such as HTML, XML, images or video files. Bulletins can be disseminated via channels as needed, like: text message, e-mail or video stream and other. This is achieved by triggering external scripts upon dissemination.
Live tabs allow to display and disseminate (export) templates. They appear as additional tabs in the Main panel.
The configuration of templates and Live tabs is described in Bulletins, templates and Live tabs configuration. Note that templates are configured at the TOAST server, while the Live tabs are configured at the TOAST GUI.
Dissemination
You can disseminate a bulletin in following ways:
Via button Disseminate in a Live tab. By default this disseminates all templates of the same group. See also the configuration options below.
Via . This disseminates exactly one template.
Here are some settings related to dissemination which can be configured in the TOAST GUI.
liveTab.$name.buttonText: Change the button text for this Live tab (default is Disseminate).dissemination.behavior: The default value All disseminates all templates of the same group. If Current is configured, then only the currently rendered template is disseminated.dissemination.confirmationRequired: If it is set, before dissemination (that is, before the bulletins are saved and before the external scripts in the templates are executed), the additional dialog: “Do you really want to continue?” pops up.dissemination.alwaysShowAdditionalOptions: If it is set, before dissemination the dialog “Execute with additional options” pops up. If it is not set, then the dialog pops up only after long mouse click.dissemination.selectionBehavior: This configures the pre-selection of the templates in the dialog from above.dissemination.selectionMode: This configures if in the template dialog only one or multiple templates can be selected.
Note
dissemination.confirmationRequired is by default True and
dissemination.alwaysShowAdditionalOptions is by default False.
However, in some cases it is more useful to configure them in the opposite
way as latter dialog offers more options.
Dissemination counter
Every template has a dissemination or revision counter per incident.
Each time the template is disseminated, the counter is increased by 1.
The count is stored in the database at the TOAST server and shared by all
TOAST GUI instances.
It is accessed in a template using the revision variable, see revision.
Template file examples
The TOAST template file examples are located at: ~/seiscomp/share/toastd/templates and the example scripts at: ~/seiscomp/share/toast/scripts. The standard installation package contains the following example templates:
forecast_zones.html, forecast_zones.kml, forecast_zones.txt
video (export as mp4)
ptwc_info.html, ptwc_local.html, ptwc_ocean.html, ptwc_region.html
ssh_max.kml
Note
Before using the templates, remove the file ending .example, to avoid overwriting during a TOAST update:
sysop@host:~$ cp $SEISCOMP_ROOT/share/toast/templates/ptwc_ocean.html.example $SEISCOMP_ROOT/share/toast/templates/ptwc_ocean.html
Here is the example bulletin PTWC Ocean. See below for the template code.
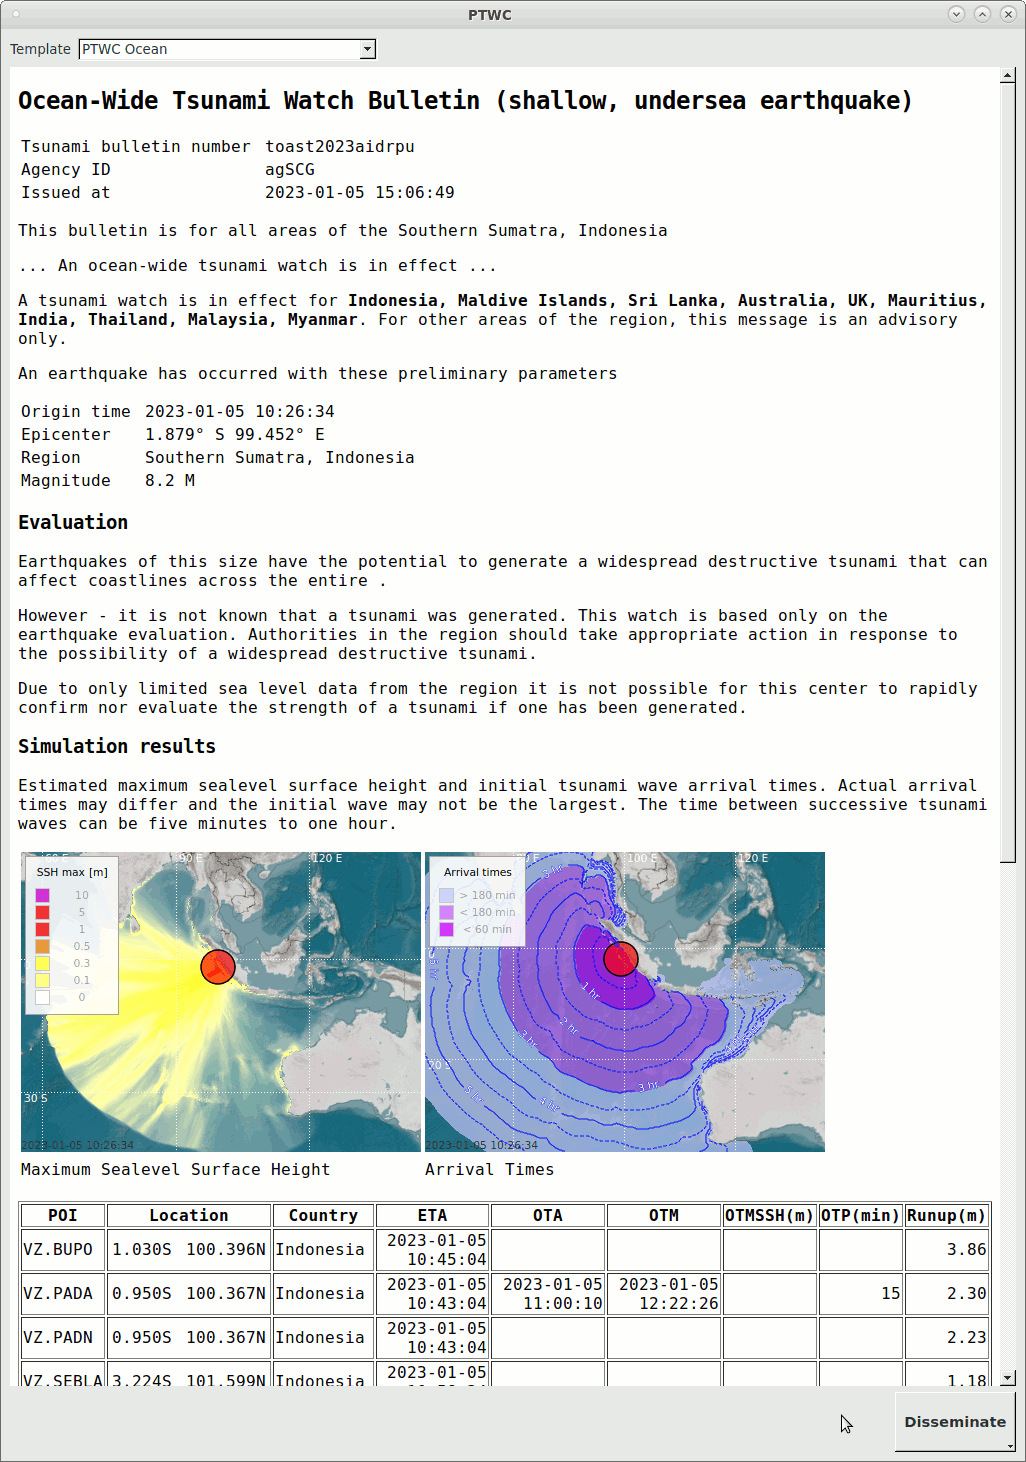
Live tab PTWC (undocked) with selected template PTWC Ocean
Hint
The sorting of the arrivals table in a bulletin depends on the sorting of the Arrivals perspective. The snapshot of a map in a bulletin shows by default the snapshot as selected in the Map perspective.
This is the template code ptwc_ocean.html, which generates the bulletin shown above:
<?cs set:countries = ""
?><?cs each:item = Arrivals
?><?cs if:item.T1Time || item.OTA
?><?cs if:item.Country && ( string.find(countries, item.Country) == -1 )
?><?cs if:countries == ""
?><?cs set:countries = item.Country
?><?cs else
?><?cs set:countries = countries + ", " + item.Country
?><?cs /if
?><?cs /if
?><?cs /if
?><?cs /each
?><?cs set:path = "/tmp/toast/" + strftime(origin.time, "%Y/%m/%d/") + ID
?><?cs var:setCurrentDir(path)
?><?cs var:save("bulletin.html")
?><?cs var:setSize(400,300)
?> <?cs var:addScript("@DATADIR@/toast/scripts/disseminate.sh " + ID)
?><!DOCTYPE HTML PUBLIC "-//W3C//DTD HTML 4.01//EN"
"http://www.w3.org/TR/html4/strict.dtd">
<html>
<head>
<meta content="text/html; charset=utf-8" http-equiv="content-type">
<title>Tsunami Watch Bulletin</title>
</head>
<body>
<h2>
Ocean-Wide Tsunami Watch Bulletin (shallow, undersea earthquake)
</h2>
<p>
</p>
<table>
<tr><td>Tsunami bulletin number </td><td><?cs var:ID ?></td></tr>
<tr><td>Agency ID</td> <td><?cs var:agencyID ?></td></tr>
<tr><td>Issued at</td> <td><?cs var:strftime(creationTime, "%F %T") ?></td></tr>
</table>
<p>
This bulletin is for all areas of the <?cs var:origin.region ?>
</p>
<p>
... An ocean-wide tsunami watch is in effect ...
</p>
<p>
A tsunami watch is in effect for <b><?cs var:countries ?></b>. For other areas of the <?cs var:region ?> region, this message is an advisory only.
</p>
<p>
An earthquake has occurred with these preliminary parameters<br>
</p>
<table>
<tr>
<td>Origin time </td>
<td><?cs var:strftime(origin.time, "%F %T") ?></td>
</tr>
<tr>
<td>Epicenter</td>
<td> <?cs var:strfcoord(origin.latitude, "%.3F° %c") ?> <?cs var:strfcoord(origin.longitude, "%.3F° %C") ?></td>
</tr>
<tr>
<td>Region</td>
<td><?cs var:origin.region ?></td>
</tr>
<tr>
<td>Magnitude</td>
<td><?cs var:float(origin.magnitude, 1) ?> <?cs var:origin.magnitude.type ?></td>
</tr>
</table>
<h3>Evaluation</h3>
<p>
Earthquakes of this size have the potential to generate a widespread destructive tsunami that can affect coastlines across the entire <?cs var:region ?>.
</p>
<p>
However - it is not known that a tsunami was generated. This watch is based only on the earthquake evaluation. Authorities in the region should take appropriate action in response to the possibility of a widespread destructive tsunami.
</p>
<p>
Due to only limited sea level data from the region it is not possible for this center to rapidly confirm nor evaluate the strength of a tsunami if one has been generated.
</p>
<h3>Simulation results</h3>
<p>Estimated maximum sealevel surface height and initial tsunami wave arrival times. Actual arrival times may differ and the initial wave may not be the largest. The time between successive tsunami waves can be five minutes to one hour.
</p>
<table>
<tr><td><img src="<?cs var:addGrid("SSH max", "*", 0, true)
?><?cs var:setOriginSymbol("circle", false)
?><?cs var:setGradientProfile("DefaultProfile")
?><?cs var:renderMeta("ptwc_ocean_sshmax.png", true) ?>" alt = ""></td>
<td><img src="<?cs var:addGrid("Arrival times", "*", 0, true)
?><?cs var:addGrid("Arrival lines", "*", 0, false)
?><?cs var:setOriginSymbol("circle", false)
?><?cs var:setRenderOptions("mapProjection=Rectangular, mapZoomLevel=5.0, showMap=true, showGlobalGeoFeature=false, showGrid=true, showGrayScale=false")
?><?cs var:renderMeta("ptwc_ocean_arrivaltimes.png", true) ?>" alt = ""></td></tr>
<tr><td>Maximum Sealevel Surface Height</td> <td>Arrival Times</td></tr>
</table>
<br />
<table border="1">
<tr>
<th>POI</th>
<th>Location</th>
<th>Country</th>
<th>ETA</th>
<th>OTA</th>
<th>OTM</th>
<th>OMSSH(m)</th>
<th>OTP(min)</th>
<th>Runup(m)</th>
</tr>
<?cs each:item = Arrivals ?><?cs if:(item.T1Time || item.OTA) && ge(item.Runup, "0.25")
?><tr>
<td><?cs var:item.POI ?></td>
<td><table border="0" width="100%">
<col width="50%">
<col width="50%">
<tr>
<td align="right"><?cs var:strfcoord(item.Location.latitude, "%.3F%c") ?> </td>
<td align="right"><?cs var:strfcoord(item.Location.longitude, "%.3F%c") ?></td>
</tr>
</table>
</td>
<td><?cs var:item.Country ?></td>
<td align="right"><?cs var:item.T1Time ?></td>
<td align="right"><?cs var:item.OTA ?></td>
<td align="right"><?cs var:item.OTM ?></td>
<td align="right"><?cs if:item.OMSSH ?><?cs var:float(item.OMSSH, 2) ?><?cs /if ?></td>
<td align="right"><?cs if:item.OTP ?><?cs var:float(item.OTP, 1) ?><?cs /if ?></td>
<td align="right"><?cs if:item.Runup ?><?cs var:float(item.Runup, 2) ?><?cs /if ?></td>
</tr><?cs /if
?><?cs /each ?>
</table>
<p>
This will be the only bulletin issued by the <?cs var:agencyID ?> for this event unless additional information becomes available.
</p>
</body>
</html>
Note
If Test mode is active, a template is only rendered if it contains the ClearSilver attribute testMode somewhere in an if/elif/else clause. For instance, a TEST header can be added or the dissemination while in test mode can be directed to a different target.
Template editor
The template editor can be used to modify the bulletins of the current incident. It is launched by double-click or on a template in the template tree panel. Save stores the template in the database, while Export… saves the template as text file on the file system.
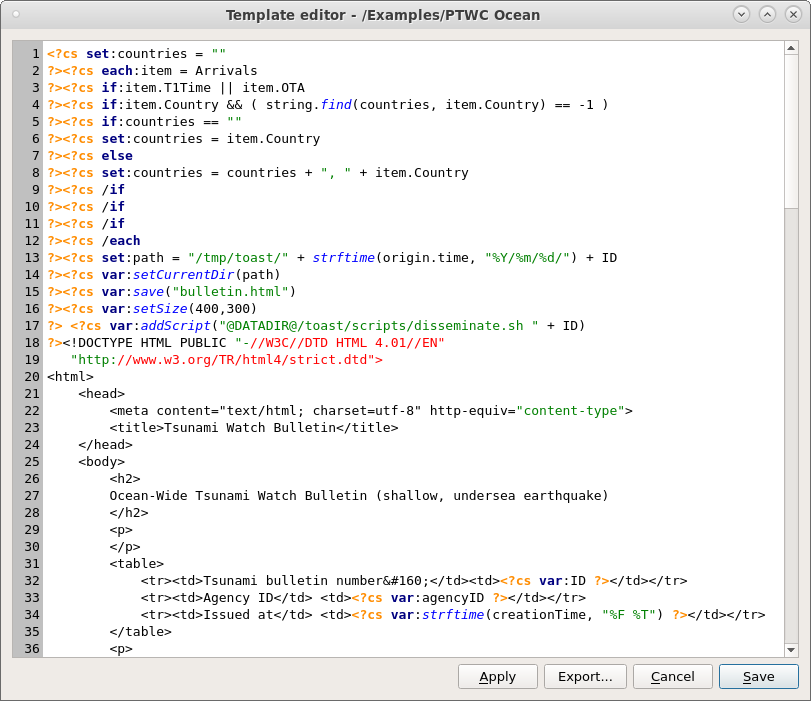
TOAST template editor.
Template changes persistence
Note
The templates are stored in the database together with an incident when an incident is created. Modifications affect only the templates of the current incident.
In order to make changes available for new incidents, the modified template has to be saved on the file system at the location where it is imported by the TOAST server. The TOAST server has to be restarted afterwards. After the TOAST GUI is restarted, the new templates are used for future incidents.
Template variable editor
The default content of the template variables (also called incident variables) is defined by configuration.
However, for a specific incident the content can be edited in a similar way as the templates themselves. In the template variables editor (widget), double-click on the Value field of a variable or .
Concurrent change of template variables
Note
If a user saves a modified template variable while an other user is changing variables in the same incident, then the second user is required to accept (sync) or reject the modifications by the first user before he can save his modifications.
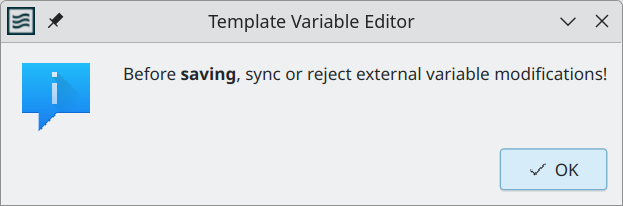
Dialog when more than one user modify variables of the same incident.
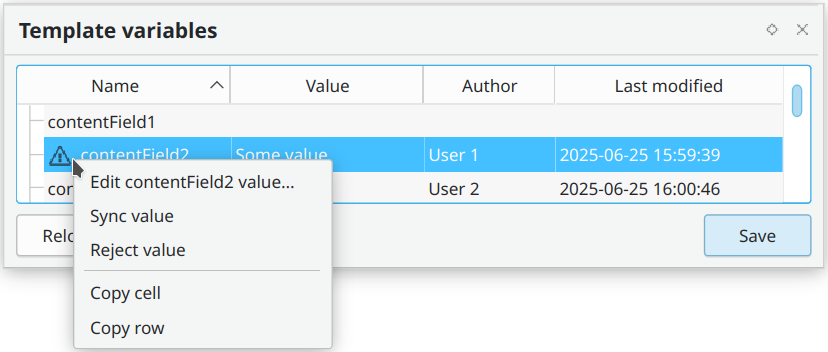
The user can either accept (sync) or reject changes by an other user, in which case the old values are stored after the user saves.
A user can load all template variable modifications by clicking Reload. The variables are also reloaded if the user leaves and reloades the incident.
Template variable changes persistence
Note
The template variables are stored in the database together with an incident when an incident is created. Changes affect only the template variables of the current incident.
In order to make changes available for new incidents, the TOAST server configuration has to be updated. The TOAST server has to be restarted afterwards. After the TOAST GUI is restarted, the new template variables are used for future incidents.
ClearSilver template syntax
Bulletins in TOAST are generated based on templates that are filled with data related to an incident, such as earthquake origin, simulation results, and forecast zone warning levels. To achieve this, TOAST uses a fast and language-neutral HTML template system called ClearSilver.
The data used to fill these templates is stored in a structured format called HDF (Hierarchical Data Format). HDF organizes information like a tree, using parent and child nodes. This structure makes it easy to access nested values inside a template.
A template defines the structure and layout of the output (e.g., a bulletin), while the HDF provides the content that is inserted into that structure. This separation between content and presentation helps keep the output logic clean, reusable, and maintainable.
The ClearSilver template syntax supports variable substitution, conditionals, loops, functions, and local variables. Each ClearSilver command starts with the opening tag <?cs and ends with the closing tag ?>.
Below, we describe the specific TOAST template variables and functions that can be used in template definitions.
For more details about ClearSilver, refer to the ClearSilver documentation, especially the sections on ClearSilver HDF and ClearSilver syntax. See also the Template file examples.
Note
A visible template in a LiveTab is executed when a simulation is made active (for example by double click) but is also updated by other actions like a change in map position or zoom level or by an event update.
Note
Some functions like save and addScript are only executed if the template is disseminated either by or the Disseminate button, see Dissemination. The isLive function can be used to explicitly determine whether a template is executed within a LiveTab or by export/dissemination.
Variables
TOAST defines variables and data sets, which are stored in the HDF. They can be accessed in the template as follows:
<?cs # Example for accessing the origin time of the incident
?><?cs var:origin.time ?>

<?cs # Example for accessing the data set Arrivals
<?cs each:item = Arrivals
   ?><?cs if:item.OTM
      ?><?cs var:item.POI ?> <?cs var:item.OTM ?> <?cs #
   ?><?cs /if
?><?cs /each ?>
Incident variables
- incidentVar.[name]
The content of the incident variable with the name ‘name’, see Template variables configuration for more information.
Common variables
- agencyID
The id of the agency.
- availableTime
Returns the available simulation duration.
- creationTime
The creation time and date of the bulletin.
- eventID
The unique identifier of the event.
- incidentID
The unique identifier of the incident.
- incident.test
- Type:
1 or 0
Specifies if the incident is marked as a test incident.
- OTAAvail
- Type:
1 or 0
Indicates if at least one station with an OTA value is available. See Arrivals perspective and Waveform picker for more information.
- OTMAvail
- Type:
1 or 0
Indicates if at least one station with an OTM value is available. See Arrivals perspective and Waveform picker for more information.
- revision
The dissemination or revision counter. It is specific per incident and per bulletin. It is incremented by 1 at each dissemination, saved in the database and shared across GUIs.
- testMode
- Type:
1 or 0
Indicates if the test mode is enabled or disabled.
Origin parameters
- origin.depth
The depth of the earthquake in km.
- origin.latitude
The latitude coordinate of the epicenter in degrees.
- origin.longitude
The longitude coordinate of the epicenter in degrees.
- origin.magnitude
Magnitude of the earthquake.
- origin.magnitude.type
Magnitude type of the earthquake.
- origin.region
The region of the earthquake.
- origin.time
The origin time.
- origin.type
The source type of the origin, e.g., earthquake.
- origin.typeComment
Provides additional information about the source type, e.g., the name of a volcano
- origin.severity
Severity of the incident. This parameter is only available when a severity is set in the incident.
Map rectangle coordinates
Access the corner coordinates of the TOAST Map perspective.
- map.box.top
Latitude coordinate of the map rectangle’s top edge.
- map.box.left
Longitude coordinate of the map rectangle’s left edge.
- map.box.bottom
Latitude coordinate of the map rectangle’s bottom edge.
- map.box.right
Longitude coordinate of the map rectangle’s right edge.
Template information
Access the configured template information, see Template configuration.
- templ.id
The ID of the template.
- templ.path
The path of the template in the template tree
- templ.name
The template name.
- templ.parent
The parent path of the template in the template tree.
Triggering template information
Access the triggering template information, see Template configuration.
- triggeringTempl.id
The ID of the triggering template
- triggeringTempl.path
The path of the triggering template in the template tree
- triggeringTempl.name
The triggering template name.
- triggeringTempl.parent
The parent path of the triggering template in the template tree
- triggeringTempl.revision
The revision of the triggering template
Note
These variables are only available in a secondary template, see Adding secondary templates for more information.
Common data sets
Arrivals
- Arrivals.[0..n - 1].[column name]
The i-th value of the arrivals overview, for instance Arrivals.0.POI.
Dissemination History
- DissHistory.[0..n - 1]
Returns the i-th disseminated bulletin.
- DissHistory.[i].Path
The path of the i-th disseminated bulletin in the template tree, for instance DissHistory.0.Path.
- DissHistory.[i].Revision
The revsion of the i-th disseminated bulletin, for instance DissHistory.0.Revision.
- DissHistory.[i].Time
The dissemination time of the i-th disseminated bulletin, for instance DissHistory.0.Time.
Forecast Zones
- ForecastZones.[0..n - 1].[column name]
The i-th value of the forecast zones overview, for instance ForecastZones.0.Name.
Simulations
- simulations.[0..n - 1]
Returns the i-th simulation.
- simulations.[i].id
The simulation ID.
- simulations.[i].type
The simulation backend used for the simulation.
- simulations.[i].source.depth
The depth in km of the simulation earthquake.
- simulations.[i].source.latitude
The latitude coordinate of epicenter in degree of the simulation earthquake.
- simulations.[i].source.longitude
The longitude coordinate of the epicenter in degree of the simulation earthquake.
- simulations.[i].source.magnitude
The magnitude of the simulation earthquake.
- simulations.[i].source.region
The region of the simulation earthquake.
- simulations.[i].source.originTime
The origin time of the simulation earthquake.
Generated Data sets
Grid rectangle coordinates
Access the corner coordinates of the last getGrid() export.
- grid.box.top
Latitude coordinate of the grid rectangle’s top edge.
- grid.box.left
Longitude coordinate of the grid rectangle’s left edge.
- grid.box.bottom
Latitude coordinate of the grid rectangle’s bottom edge.
- grid.box.right
Longitude coordinate of the grid rectangle’s right edge.
Note
The data set does not contain data until the function
getGrid() has been called.
Forecast Points
- ForecastPoints.[zone ID]-[point ID].[column name]
The forecast point with point ID assigned to forecast zone with ID ‘zone ID’, for instance ForecastPoints.61056-6100067.Name.
Note
The data set does not contain data until the function
addForecastPoints() has been called.
Nearest cities
A record of information of the nearest cities.
- NearestCities.[0..n - 1]
- NearestCities.[i].azimuth
- NearestCities.[i].distance
- NearestCities.[i].name
- NearestCities.[i].lat
- NearestCities.[i].lon
Note
The data set does not contain data until the function
nearestCities() has been called.
Threat levels for one province
- provinceThreatLevel.name
- provinceThreatLevel.threatLevel
- provinceThreatLevel.threatLevelName
- provinceThreatLevel.T1Time
- provinceThreatLevel.[ThreatLevel].[0..n-1]
- provinceThreatLevel.[ThreatLevel].[i].startPoint
- provinceThreatLevel.[ThreatLevel].[i].endPoint
- provinceThreatLevel.[ThreatLevel].[i].region
Contains province threat level for one province.
Note
The data set does not contain data until the function
computeProvinceThreatLevel() has been called.
Threat levels for provinces
- provinceThreatLevels.[0..n - 1]
- provinceThreatLevels.[i].name
- provinceThreatLevels.[i].province[0..m -1]
- provinceThreatLevels.[i].province[j].name
- provinceThreatLevels.[i].province[j].threatLevel
- provinceThreatLevels.[i].province[j].threatLevelName
- provinceThreatLevels.[i].province[j].T1Time
- provinceThreatLevels.[i].province[j].[ThreatLevel].[0..p-1]
- provinceThreatLevels.[i].province[j].[ThreatLevel].[k].startPoint
- provinceThreatLevels.[i].province[j].[ThreatLevel].[k].endPoint
- provinceThreatLevels.[i].province[j].[ThreatLevel].[k].region
Contains the i-th country and j-th province name, threat level number and threat level name.
Note
The data set does not contain data until the function
computeProvinceThreatLevels() has been called.
Mapped forecast zones
- MappedForecastZones.[0..n - 1].ID
- MappedForecastZones.[0..n - 1].MappedID
- MappedForecastZones.[0..n - 1].Place
- MappedForecastZones.[0..n - 1].MappedPlace
The i-th mapped forecast zone for which a mapping is available.
Note
The data set does not contain data until the function
mapForecastZones() has been called.
Functions
ClearSilver provides many built-in functions, see ClearSilver documentation for more details. In addition, TOAST defines several custom functions, which are listed below. Here an example how to call a function in a template:
<?cs var:setCurrentDir("/tmp/toast") ?>
Common functions
- fill(in, width, ch, align)
- Parameters:
in – The input string
width – The field width of the output
ch – The fill character which is used when the result is padded to the field width
align – Alignment of the output
- Return type:
String
Fills the input string with characters according the alignment(0 = left, 1 = right, 2 = center).
- float(in, precision)
- Parameters:
in – The input string
precision – The precision of the output
- Return type:
String
Formats floating point numbers.
- ge(arg1, arg2)
- Return type:
Boolean
Returns true if arg1 is greater than or equal to arg2.
- gt(arg1, arg2)
- Return type:
Boolean
Returns true if arg1 is greater than arg2.
- le(arg1, arg2)
- Return type:
Boolean
Returns true if arg1 is less than or equal to arg2.
- lt(arg1, arg2)
- Return type:
Boolean
Returns true if arg1 is less than arg2.
- strfazi(azimuth)
- Parameters:
azimuth – Azimuth
- Return type:
String
Prints the geographic direction.
- strfcoord(in, fmt)
- Parameters:
in – Latitude/ longitude value
fmt – The format string
- Return type:
String
Formats coordinates.
- toLower(in)
- Parameters:
in – The input string
- Return type:
String
Converts the given input string to lower case.
- toUpper(in)
- Parameters:
in – The input string
- Return type:
String
Converts the given input string to upper case.
Functions for generating data set nodes
- addForecastPoints(config)
- Parameters:
config –
Configuration options with key=value pairs. The following options can be used:
Option
Description
threatLevel
Two options: calc or fromZone. If fromZone is used, the threat level of the forecast point is the threat level of the zone. If calc is used the threat level is calculated from the forecast point values. Defaut: false
prefix
The output prefix
deletePrev
If true the previously added ForecastPoints data set is remove. If false the forecast points are added to the data set ForecastPoints.
zoneID
The zone ID for which the forecast points are extracted.
country
The assigned country of the forecast points
province
The assigned province of the forecast points
names
Predefined name list of forecast points
Fills the data set Forecast points.
Note
Forecast points can be extracted via the zone ID. If this is not given, country, province and names can be used as filters. Please note that there may be a large number of forecast points. Adding all points will significantly reduce the performance of the template evaluation.
- computeProvinceThreatLevel(config)
- Parameters:
config –
Configuration options with key=value pairs
Option
Description
useInactive
If true, the lowest threat level is assumed for the inactive forecast zones. Defaut: false
coastLineStart
Defines name of the Forecast Zone table column that is used as coast line start.
coastLineEnd
Defines name of the Forecast Zone table column that is used as coast line end.
regions
Defines name of the Forecast Zone table column that is used as region column(s).
t1TimeThreatLevels
Semicolon separated list. T1 aggreation only takes into account the forecast zones with the given threat levels.
threatLevels
Semicolon separated list. A extra calculation will be added for the combined given Threat Levels.
province
Only forecast zones with the given province(s) are taken into account.
country
Only forecast zones of the given coutries(s) are taken into account.
Fills the data set Threat levels for one province. It aggregates the threat level over forecast zones within provinces for all countries.
Here is an example how to use it:
<?cs   # Compute province threat level for the Indonesian province
?><?cs # stored in the variable 'productState' only for Watch and
?><?cs # Warning threat levels including the coastal line calculation
?><?cs var:computeProvinceThreatLevel("country=Indonesia,province=" + productState + ",useInactive=true,"
            + "coastLineStart=Start point,coastLineEnd=End point,regions=Name;Additional Regions,"
            + "threatLevels=Warning;Watch,t1TimeThreatLevels=Warning;Watch")

?>Highest Threat Level in <?cs #
      ?><?cs var:provinceThreatLevel.name ?>: <?cs #
      ?><?cs var:provinceThreatLevel.threatLevelName ?>
Coastal line and regions under threat: <?cs #
      ?><?cs each:threatLevel = provinceThreatLevel.ThreatLevel
         ?><?cs var:threatLevel.startPoint ?> to <?cs var:threatLevel.endPoint
         ?>(<?cs var:threatLevel.regions ?>)<?cs if:!last(threatLevel) ?>; <?cs /if
      ?><?cs /each
?>
- computeProvinceThreatLevels(config)
- Parameters:
config –
Configuration options with key=value pairs
Option
Description
useInactive
If true, the lowest threat level is assumed for the inactive forecast zones. Defaut: false
coastLineStart
Defines name of the Forecast Zone table column that is used as coast line start.
coastLineEnd
Defines name of the Forecast Zone table column that is used as coast line end.
regions
Defines name of the Forecast Zone table column that is used as region column(s).
t1TimeThreatLevels
Semicolon separated list. T1 aggreation only takes into account the forecast zones with the given threat levels.
threatLevels
Semicolon separated list. A extra calculation will be added for the combined given Threat Levels.
Fills the data set Threat levels for provinces. It aggregates the threat level over forecast zones within provinces for all countries. Sorting of the countries and provinces is alphabetically.
Here is an example how to use it:
<?cs var:computeProvinceThreatLevels("useInactive=true")
?><?cs each:country = provinceThreatLevels
?><?cs var:country.name ?>
  <?cs each:province = country.provinces
    ?>    <?cs var:fill(string.slice(province.name,0,20), 20, " ", 0)
    ?> - <?cs var:province.threatLevel
    ?> - <?cs var:province.threatLevelName ?>
  <?cs /each
?><?cs /each ?>
- loadGradient(profile, gradient)
- Parameters:
profile – The name of the gradient profile
gradient – The kind of the gradient
Stores the gradient values in the data set variable grad. This variable can be iterated over. Useful to generate a legend in HTML. Example:
<?cs var:loadGradient("DefaultProfile", "Forecast zones") ?>
<?cs each:item = grad.DefaultProfile.Forecastzones ?>
    <?cs var:item.color ?> <?cs var:item.text ?>
<?cs /each ?>
- loadJSON(filename)
- Parameters:
filename – The filename of the JSON file
Loads a JSON file and makes the content available as variables in the data set, so that the content can also be accessed iteratively. This is useful to include data for test runs from external files. Example:
<?cs var:loadJSON("@DATADIR@/toast/templates/training_definitions.json") ?>
<?cs if:testMode ?> Description: <?cs var:description ?>
    <?cs each:zone = testForecastZones ?>
        Name: <?cs var:zone.name ?>
        Code: <?cs var:zone.code ?>
    <?cs /each ?>
<?cs /if ?>
for the JSON file training_definitions.json:
{
    "description": "Test Description",
    "testForecastZones": [
        {
            "name": "Zone 1",
            "code": "1"
        },
        {
            "name": "Zone 2",
            "code": "2"
        }
    ]
}
- mapForecastZones(...)
Maps ID and place of Forecast Zones to values defined in a data set node Mapping. Fills the data set Mapped forecast zones.
Note
The data set must contain a mapping node (Mapping).
- nearestCities(lat, lon, maxDist, minPopulation, maxCount)
- Parameters:
lat – Position for which the nearest cities are to be searched
lon – Position for which the nearest cities are to be searched
maxDist – Maximum distance from position to city
minPopulation – Minimum population of the city
maxCount – Maximum number of cities
Fills the data set Nearest cities.
Variables and data sets manipulators
- hdfCategorize(nodeName, config)
- Parameters:
nodeName – Node that children should be categorized
options –
Configuration options - a comma separated list with ‘=’ to assign the value to the variable.
Option
Description
category
The category node name
prefix
The name of the new data set node.
sortBy
The sort column.
columns
Semicolon separated list. Defines the columns that should be considered in the new category node.
threatLevelFilter
The categorization only takes into account the forecast zones with the given threat levels.
Categorizes a data set node based on the grandchild node. This creates a new data set node. The child nodes can have a different order. A restricted list of children can be transferred from the old structure. It can also be filtered according to the threat level.
- hdfDump(nodeName)
- Parameters:
nodeName – Node to dump (name or empty string)
Dumps the data set node and its children to stdout. If no node name is specified, the entire data set is dumped.
- hdfGetVar(nodeName)
- Parameters:
nodeName – The node name
- Return type:
String
Returns the value of a node. This method is very usefull if the node name is set dynamically in the template.
- hdfGetPrevVar(nodeName)
- Parameters:
nodeName – The node name
- Return type:
String
Returns the value of a node from the data set of the previous dissemination run of this template
- hdfSetVar(nodeName, prefix, value)
- Parameters:
nodeName – Node that children should be categorized
prefix – Node prefix
value – The new value
Sets the value of a node in the data set.
- hdfSort(nodeName, column)
- Parameters:
nodeName – Name of the HDF node whose children should be sorted.
column – Child key whose value is used as the sorting criterion.
Sorts the children of the given HDF node in place based on the value of the specified child key. The order of the child nodes is modified in the HDF structure, and subsequent
<?cs each:... ?>iterations reflect the updated order.Returns an error if the node does not exist or if insufficient arguments are provided.
- hdfWriteFile(node, childName)
- Parameters:
name – Node whose child objects are to be sorted
childName – Node value used for sorting
Writes the data set node and its children to the given file. If no node name is specified, the entire data set is used.
- hdfPrevWriteFile(nodeName, filename)
- Parameters:
nodeName – Node name for export or empty
filename – Output file name
Writes the data set node and its children of the previous dissemination run to the given file. If no node name is specified, the entire data set is used.
- hasChanged(name)
- Parameters:
name – Variable name
- Returns:
“0” if both values are equal
”1” if both values are set but are distinct
”-1” if the value is not set at all
”-2” if the value is not set in the current context
”-3” if the value is not set in the previous context
- Return type:
int
Compares the variable content of the current template context with the variable content of the previously disseminated bulletin context.
- hasChangedRecursive(name)
- Parameters:
name – Dataset name
- Returns:
“0” if both datasets are equal
”1” if any node in the datasets is distinct
”-1” if the datasets root node is not set at all
”-2” if the datasets root node is not set in the current context
”-3” if the datasets root node is not set in the previous context
- Return type:
int
Recursively compares datasets of current template context with the dataset in the previously dissminated bulletin context.
Others
- gfContains(filename, name, lat, lon)
- Parameters:
filename – Filename of the GeoJSON or BNA file
name – Geo feature name
lat – Geo coordinate
lon – Geo coordinate
- Return type:
Int (“1” if coordinate is contained by a geofeature, else “0”)
Tests if a geo coordinate is contained by a particular geofeature defined in a GeoJSON or BNA file and identified by a name.
- gfsContains(filename, lat, lon)
- Parameters:
filename – Filename of the GeoJSON or BNA file
lat – Geo coordinate
lon – Geo coordinate
- Return type:
Int (“1” if coordinate is contained by a geofeature, else “0”)
Tests if a geo coordinate is contained by any geofeature defined in a GeoJSON or BNA file
- gfName(filename, lat, lon)
- Parameters:
filename – Filename of the GeoJSON or BNA file
lat – Geo coordinate
lon – Geo coordinate
- Return type:
String
Looks up polygon name for a geo coordinate.
- isLive()
- Return type:
Boolean
Returns whether the template is displayed in a Live tab.
- loadTranslation(filename)
- Parameters:
filename – The filename of the translation map file in INI format
Loads translation map from file. See also function
translate().
- setLineLength(length)
- Parameters:
length – The text line length
Sets the maximum text line length.
- httpGET(url, timeout)
- Parameters:
url – The URL
timeout – The request timeout in seconds
Requests data via HTTP/GET
- threatLevelAsText(in)
- Parameters:
in – Threat level number (as string or integer).
- Return type:
String
Returns the name corresponding to the threat level number as defined in the threat level configuration.
- translate(str, prefix)
- Parameters:
str – The string to translate.
str – A prefix
- Return type:
The translated word if a translation is available, otherwise the str.
Translates a given string based on the translation loaded with
loadTranslation().
Set paths and save bulletins
- resolvePath(path)
- Parameters:
path – Path which can contain SeisComP variables
Returns the absolute path with resolved SeisComP variables. Example:
<?cs set:dataToast = resolvePath("@DATADIR@/toast/") ?>
- save(filename)
- Parameters:
filename – Output file name
Saves the content of the bulletin to the file with the given filename.
- saveArrivalLines(simType, filename, prettyPrint)
- Parameters:
simType – Simulation type, for example “*” for all types or “EasyWave2”
filename – Filename of the output GeoJSON file
prettyPrint – Pretty print JSON output (false/true)
Saves arrival lines of the selected simulation(s) to a file in GeoJSON format. Example:
<?cs var:saveArrivalLines("/tmp/arrivallines.geojson", "*", false) ?>
- setCurrentDir(path)
- Parameters:
path – The absolute path
Changes the current working directory to the directory given in path. If the directory doesn’t exit, it is created.
- tmpFile(template)
- Parameters:
template – Template for the temporary filename.
- Returns:
Filename
- Return type:
String
Generates a unique temporary filename from template, creates and opens the file, and returns the filename. The temporary file is removed when the script is finished.
A temporary file has a static part of the name and a part that is calculated so that it is unique. If it contains ‘XXXXXX’, this part will be replaced by a auto-generated portion of the filename.
Add script
Secondary templates
Secondary templates can be added for evaluation after the main template has been processed. These templates share the same HDF file structure (see ClearSilver) as the main template. This means the main template receives the HDF and can, for example, add variables to it. The modified HDF then serves as input for the first secondary template. That template can further modify the data, and its resulting HDF is passed on to the next secondary template, and so on.
Keep this behavior in mind when working with secondary templates: It can be especially useful for disseminating multiple templates for different channels simultaneously - for example, sending both an email and an SMS at the same time.
Note
Secondary templates are only evaluated during dissemination. They are ignored in live preview (see Live tab).
- addTemplate(filename)
- Parameters:
filename – The path of the template in the template tree
Adds a secondary template
Generate images
- getGrid(type, simType, step, fileName)
- Parameters:
type – Type of the grid; currently available: “SSH max”, “SSH”, “Arrival times”
simType – Simulation type, for example “*” for all types or “EasyWave2”
step – Time step
fileName – Output file
Save the simulation results for the layer name of simulation type simType for the given time step as an image to the given filename. Sets
grid.box.left,grid.box.right,grid.box.topandgrid.box.bottomto the grid coordinates.
- render(fileName, showLink)
- Parameters:
fileName – Output file
showLink – Indicates whether a link to the result is returned or not
- Return type:
The link to the resulting image as string if showLink is set to true
Renders the current rendering stack and saves the result as an image to the given filename.
- renderMeta(fileName, showLink)
- Parameters:
fileName – Output file
showLink – Indicates whether a link to the result is returned or not
- Return type:
The link to the resulting image as string if showLink is set to true
The function renderMeta is the same as render, except that it additionally writes meta information about the rendering stack into an extra file with ending .meta in JSON format. This is useful if images have to be georeferenced.
Note
See function saveArrivalLines to export arrival lines in GeoJSON format.
Configure images
- addGrid(type, simType, step, config)
- Parameters:
type – Name of the grid; possible options: “SSH max”, “SSH”, “Arrival times”, “Arrival lines”
simType – Simulation type, for example “*” for all types or “EasyWave2”
step – Time step in seconds.
config –
Configuration of the grid. A comma separated list with ‘=’ to assign the value to the variable (for example “legendTitle=Arrival times, arrivalFontSize=10, legendOrientation=’vertical’”). Supported variables for the config parameter are:
Variable
Type
showLegend
bool
legendTitle
string
legendTextAlign
’left’, ‘right’, ‘center’
legendFontSize
int
legendFontBold
bool
legendSpacing
int
legendOrientation
’horizontal’, ‘vertical’
legendReverseText
string
gradient
string
gradientProfile
string
arrivalFontSize
int (available for layer ‘Arrival lines’)
Adds a grid to the rendering stack.
- addLayer(type, config)
- Parameters:
type – Name of the layer; possible options: “forecast zones”, “geofeature”.
config –
In addition to the general configuration options (see supported config parameters for addGrid), the following are also available for the individual layers:
Layer
Config options
forecast zones
gradient (string), gradientProfile (string), drawFilled (bool), drawInactive (bool), drawInactiveColorized (bool), inactiveFillColor (string), inactiveLineColor (string), defaultLineColor (string), brush (string)
geofeature
file (string), dir (string), renderAsVector (bool)
Adds a layer to the rendering stack.
- addOriginImage(config)
- Parameters:
config –
Configuration options as comma separated list with ‘=’ as separator to assign the value to the variable (for example “mapZoomLevel=8.0,imageSize=30 21”). The following parameters influence both the size of the image and its position on the image:
Option
Type
Example
mapCenter
number number
0 -180
mapZoomLevel
number
1
imageSize
number number
140 180
imagePos
number number
321 123
Renders a small image on the rendered image (image-in-image). This map only shows the origin of the incident and no other layers or grids
- setOriginSymbol(shape, fill)
- Parameters:
shape – Name of the shape; available shapes are circle (black border as in map view), circle-seiscomp (red border as in SeisComP) and star. The default shape is circle
fill – Indicates whether the symbol should be filled or not (default: filled).
Sets the origin symbol of the map.
- setGradientProfile(name)
- Parameters:
name – Gradient profile name
Set the gradient profile to the given name. For more information on color gradients, see Color profiles and gradients configuration.
- setRenderOptions(config)
- Parameters:
config –
Configuration options as comma separated list with ‘=’ as separator to assign the value to the variable (for example “mapProjection=Rectangular, mapZoomLevel=8.0”). Supported options:
Option
Type
Default Value
Example
backgroundColor
string
white
encodeBase64
bool
true
false
gridDist
number number
15 15
10 20
imageQuality
number
100
mapCenter
number number
TOAST GUI map value
-5.0 100.0
mapProjection
string
TOAST GUI map value
Rectangular
mapZoomLevel
number
TOAST GUI map value
8.0
showCities
bool
false
true
showGlobalGeoFeature
bool
true
false
showGrid
bool
true
true
showGrayScale
bool
false
false
showMap
bool
true
true
showTimeStamp
bool
true
true
showOriginTime
bool
false
true
Sets the rendering options for the next generated image.
- setScenarioColors(colors)
- Parameters:
colors (string (comma-separated list)) – List of colors, for example “white, red”
Set the colors of the active simulations, for example used for arrival lines color. The order defines the assignment to the simulations based on the selection in TOAST.
- alignLegends(inout, orientation, align)
- Parameters:
inout – Legends inside or outside of the image (“in”,”out” or “”; default: inside)
orientation – Horizontal or vertical legend (“horizontal”, “vertical” or “”; default: vertical)
align – Alignment of legend (“left”, “right”, “bottom”, “top” or mixed values; default: top)
Set the alignment and the orientation of the legends and if the legends should be rendered in or outside the image.
- setGlobalLayerConfig(str)
- Parameters:
str – String with information about the configuration for all layers.
- Return type:
String
Sets the global layer configuration, which applies to all layers and grids for future generated images. This configuration serves as the default for all layers and grids but can be overridden for individual layers using the funtions
addLayer()oraddGrid().See layer configuration for more detail.
Note
This configuration is not applied to images generated with the function
getGrid().
- setWatermark(str)
- Parameters:
str – The watermark text
- Return type:
String
Customizes the generated images with the given text. This can be used for adding copyright information.
- showCurrentStepTime(enable)
- Parameters:
enable – Indicates if the current step should be shown
- Deprecated:
Please use
setRenderOptions().
Enable the current time step in the image.
- forecastZone(id)
- Parameters:
id – ID of a forecast zone
- Return type:
string
Returns the forecast zone in kml format.
- useLocalTime(enable)
- Parameters:
enable – Indicates if local time should be used
Set the time indicating the time step of the image to local time. By default the time is shown in UTC.
Set image size
- setDisplayRect(lat, lon, height, width)
- Parameters:
lat – The bottom-left position
lon – The bottom-left position
height – Height of the rectangle
width – Width of the rectangle
Sets the visible region of the map from bottom-left corner, width and height. The aspect ratio needs to be similar to the selected output size to fit.
- setDisplayCoords(minLat, minLon, maxLat, maxLon)
- Parameters:
minLat – The top-left position
minLon – The top-left position
maxLat – The bottom-right position
maxLon – The bottom-right position
Sets the visible region of the map from the top-left to the bottom-right corner. The aspect ratio needs to be similar to the selected output size to fit.
- setSize(width, height)
- Parameters:
width – The width of the output image
height – The height of the output image
Sets the size of the output image.
- setMegapixel(megaPixel)
- Parameters:
megaPixel – Number of mega pixel (floating point)
Sets the image size to approximately megaPixel.
Includes
ClearSilver supports to include templates which allows, for example, to share parts between several templates. In contrast to the default ClearSilver implementation, TOAST also tries to load the requested resource from the available template tree. The function expects the path in the template tree as an argument. Here is an example that includes the template Definitions at the base of the tree:
<?cs include:"/Definitions" ?>