Show Grids on Maps of Other GUIs
While the generated PNG files can be viewed by appropriate system tools, the generated grid files can be directly shown on maps of any SeisComP GUI and automatically updated using the gempa plugin mapmultigrid [9]. Properties such as colors, contours or legends may be configured.
The resulting map may look like this in scmv:
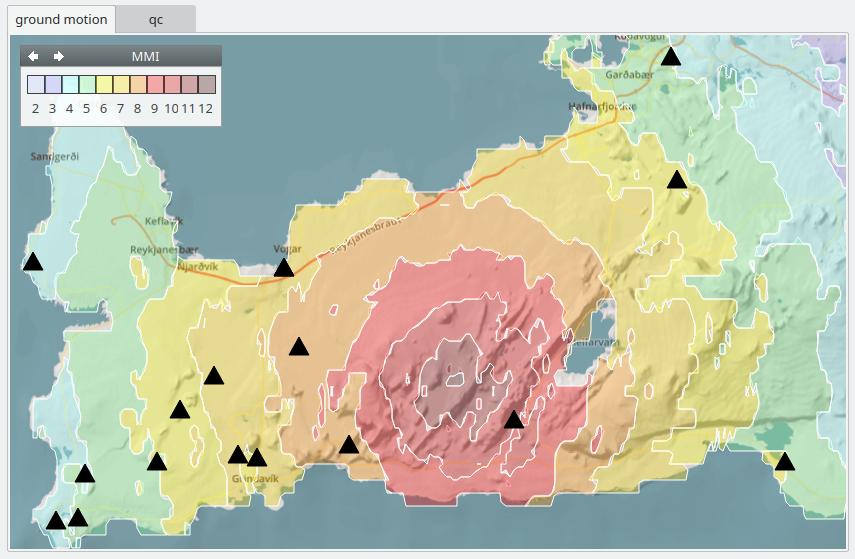
Figure 36: scmv showing the MMI grid generated by autosigma.
Note
The mapmultigrid [9] plugin may be received from gempa GmbH as part of the mapprojections package.
Example Configuration
Configure global.cfg to show the generate MMI grid like in the figure above
on any map of SeisComP or gempa GUI modules.
In this example, the grid is located in /home/sysop/.seiscomp/log/autosigma/grid-mmi.grd.
Transparency is applied to view the underlying map. A legend explains the color
coding:
plugins = ${plugins}, mapmultigrid

map.customLayers = multigrid
map.multigrid.profiles = mmi
map.multigrid.mode = poly

map.multigrid.styles {

  major.pen.color = white
  major.pen.style = solidline
  major.pen.width = 1

  minor.pen.color = white
  minor.pen.style = dashline
}

map.multigrid.profiles.mmi {

  watch = /home/sysop/.seiscomp/log/autosigma/grid-mmi.grd
  stops = 2:bfccff50:"major",3:9999ff50:"major",4:88ffff50:"major",5:7df89450:"major",6:ffff0050:"major",7:ffdd0050:"major",8:ff910050:"major",9:ff000050:"major",10:dd000050:"major",11:88000050:"major",12:44000050:"major"
  visible = true
  renderBackToFront = true
  composition = "src-over"
  title = "MMI"
  legendArea = topleft
}