
scmvx
Map view showing maps with stations and events. Issues related to configuration of stations are indicated.
Description
scmvx (SeisComP map view extended) provides maps that visualize information of stations, events and phase picks at stations. Events are received and updated in real time or loaded from a SeisComP database. Stations are loaded from inventory independent of bindings but compared with bindings. Station information include:
Location (not sensor location) along with network, station and full stream code. The latter is defined by global bindings.
Current ground motion.
Current station quality.
Current trigger status.
Instantaneous waveforms.
Station inventory and bindings configuration issues.
The maps can be customized by global scheme.map parameters and
additional layers can be added as outlined in the
GUI documentation.
scmvx shows all information in tabes which are outlined in section Tabs. More applications and use cases are described in section Use Cases.
Note
scmvx is the next generation of scmv which is deprecated but shipped along with the SeisComP package for maintaining backwards compatibility.
Tabs
scmvx provides multiple tabs for visualizing stations along with station parameters or issues and for showing events updated in real time or read from the SeisComP database:
Network: Map showing events and network information including station configuration and inventory issues.
Ground motion: Map with events and stations. The color of stations symbols represents recent ground motion calculated by scmvx in a configurable time window.
Quality control: Map with events and stations. The color of stations symbols represents recent waveform quality control parameters calculated by scqc.
Events: Event list updated in real time and allowing to filter events and to load historic events from database.
Stations with recent phase picks are blinking with red triangles. When a new event arrives, the details are shown and updated in the latest event field. Yellow and blue circles indicate the predicted wavefronts of P and S phases, respectively. The wavefronts fade out and disappear depending on magnitude.
Any tab can be shown in full-screen mode (F11) where it is detached from the main window and shown without any frame.
Note
The following figures show maps which are optimized for file size (134 MByte) and coloring and made available by gempa GmbH [32]:
cd Downloads
wget -O /tmp/maps.tar "https://data.gempa.de/packages/Public/maps/gempa-minimal/gempa-minimal.tar"
cd $SEISCOMP_ROOT/..
tar -xvf /tmp/maps.tar
rm /tmp/maps.tar
You may add the maps to your global configuration
($SEISCOMP_ROOT/etc/global.cfg):
map.location = @DATADIR@/maps/world%s.png
map.format = mercator
Network
The network tab shows all stations available with the loaded inventory. Station symbols (triangles) and event (circles) are color-coded according to network code and source depth, respectively. Activate the legend (right-click on map) for the color-coding. Stations having issues in global bindings or inventory are highlighted by error symbols.
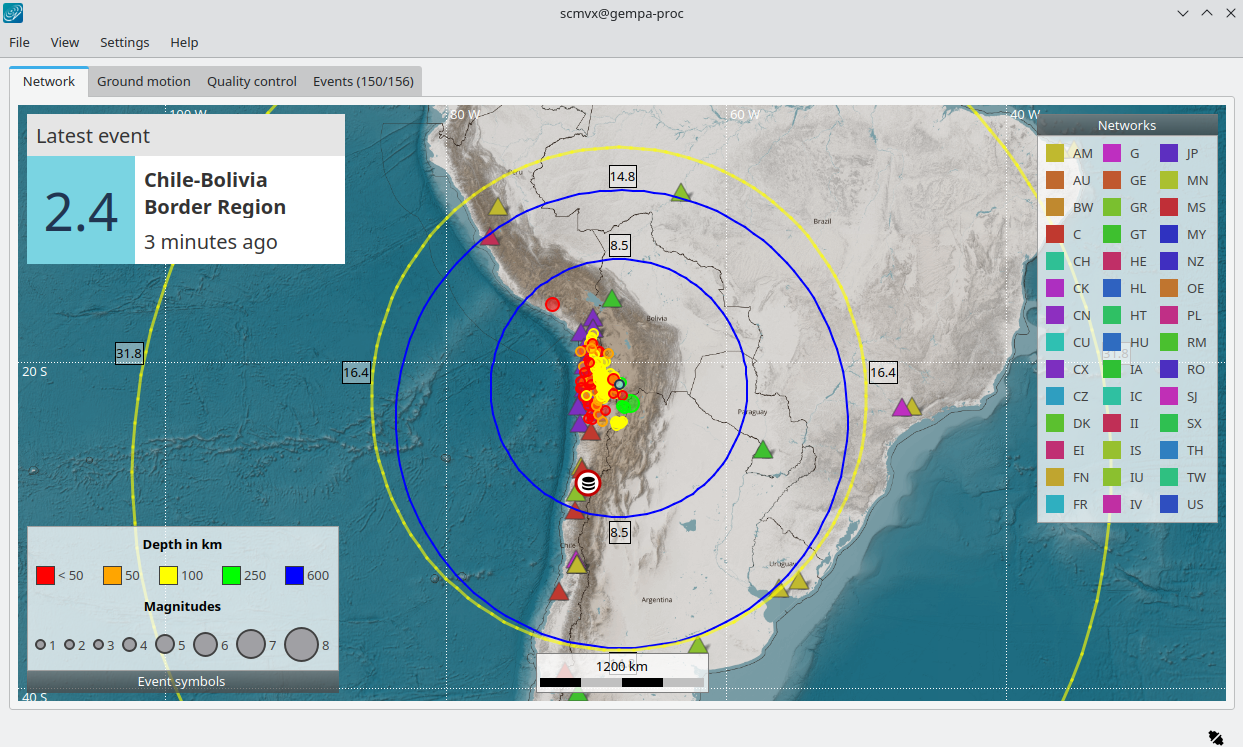
Network tab showing stations and events. Two events were received recently. The yellow and blue circles indicate the predicted wavefronts of P and S phases, respectively, with their degrees of epicentral distance shown next to the circles.
Clicking on a station opens the details view showing stations details and waveforms. Issues are explained.
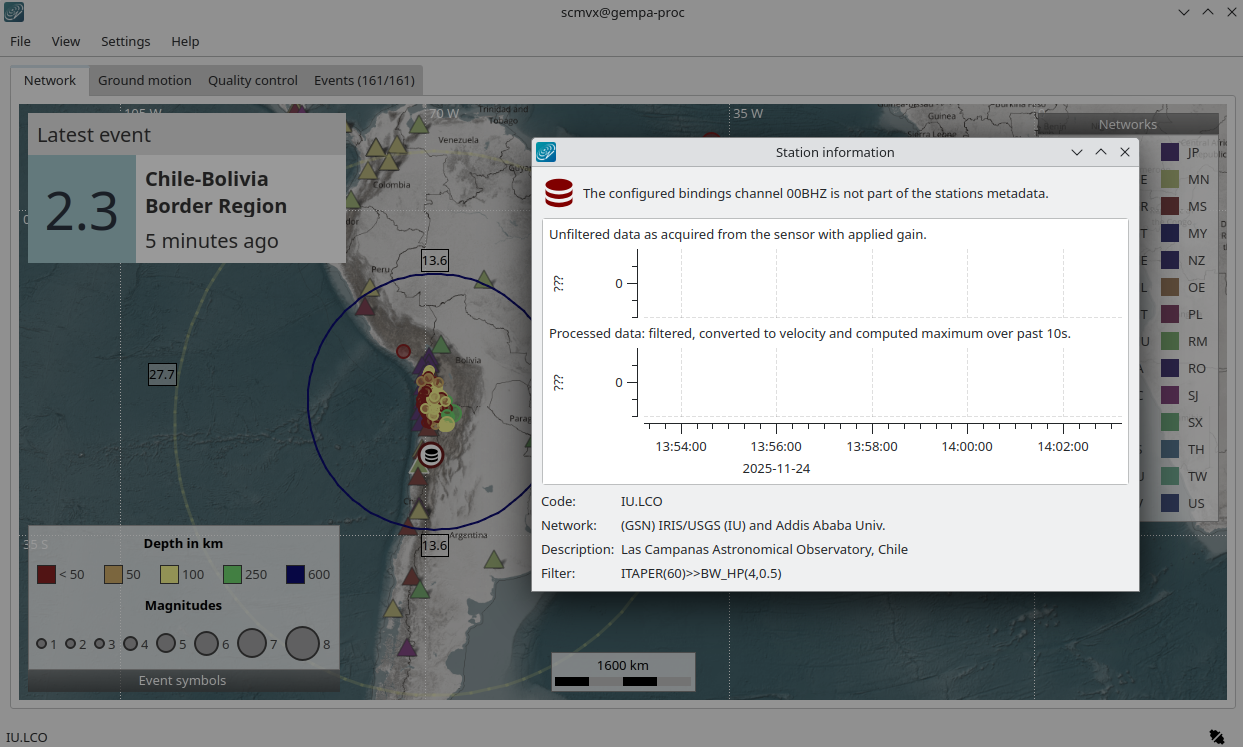
Network tab explaining a conflict of a station binding configuration with loaded inventory. Click on the corresponding station symbol for opening the details view.
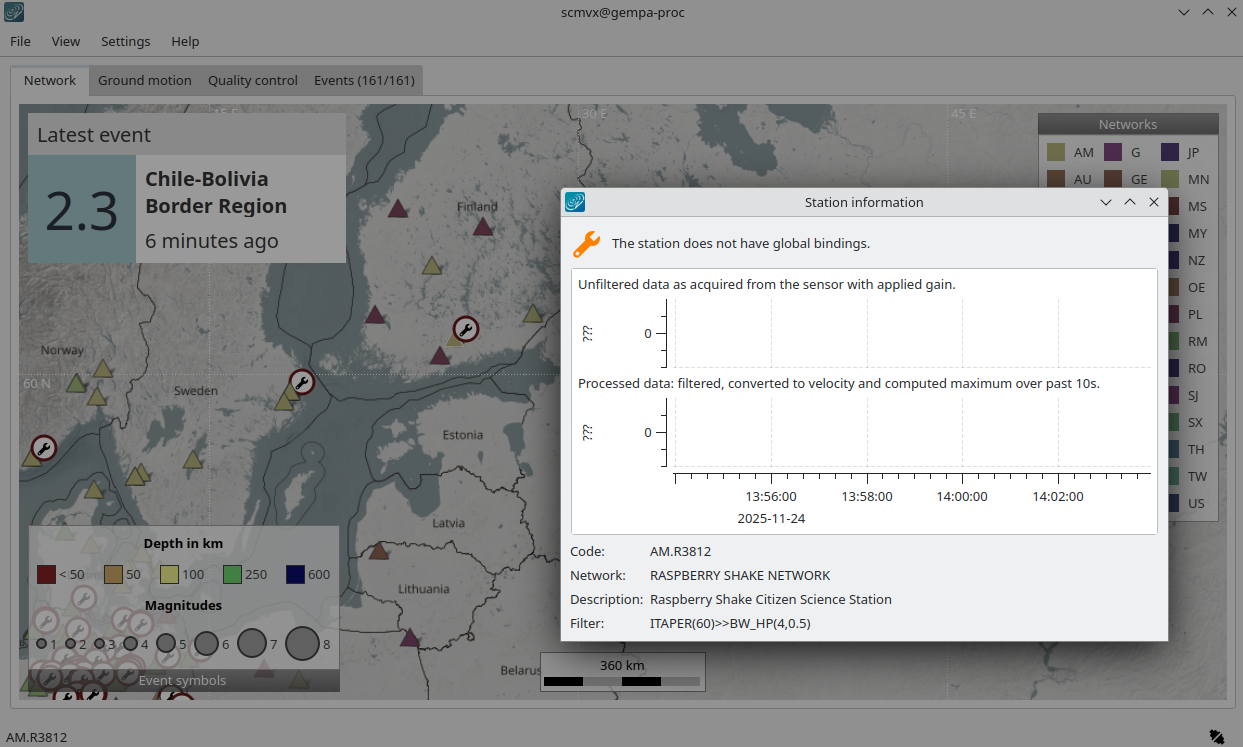
Network tab indicating a station with missing global bindings.
Ground motion
The ground motion tab shows the current ground motion situation at a station. Station symbols (triangles) and event (circles) are color-coded according to recent ground motion and source depth, respectively.
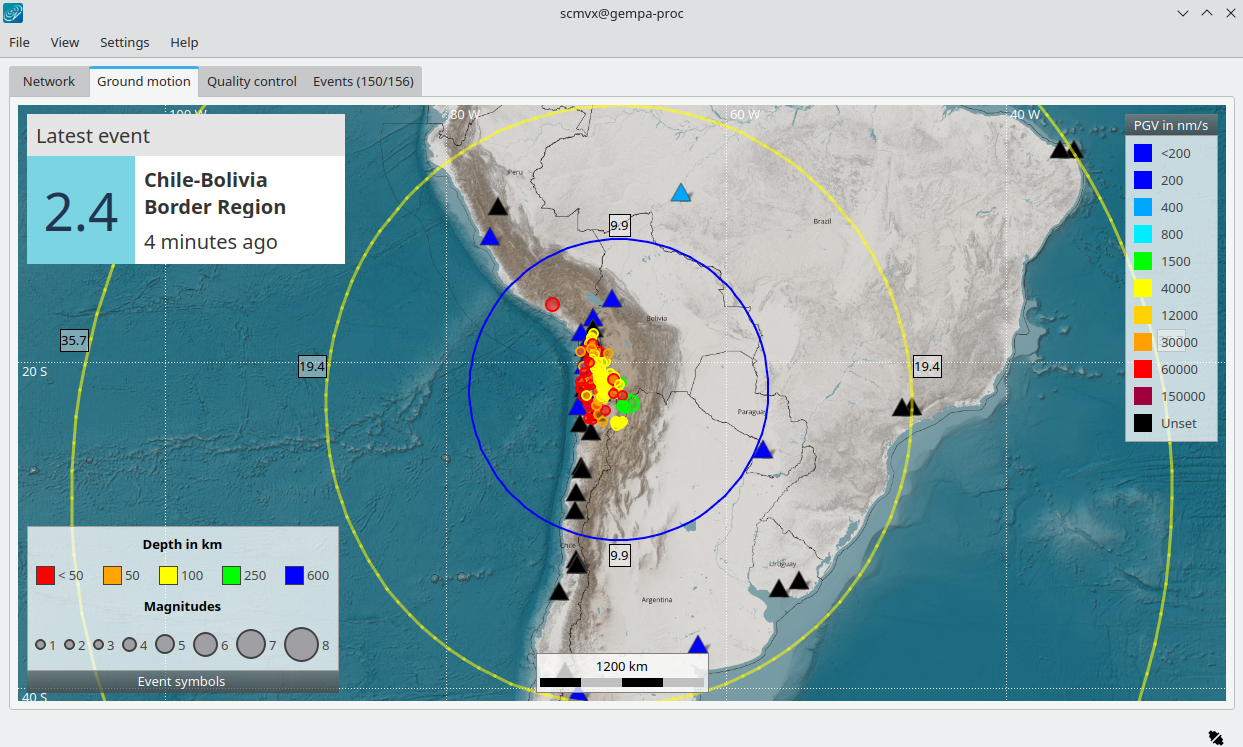
Ground motion tab with stations (triangles) and events.
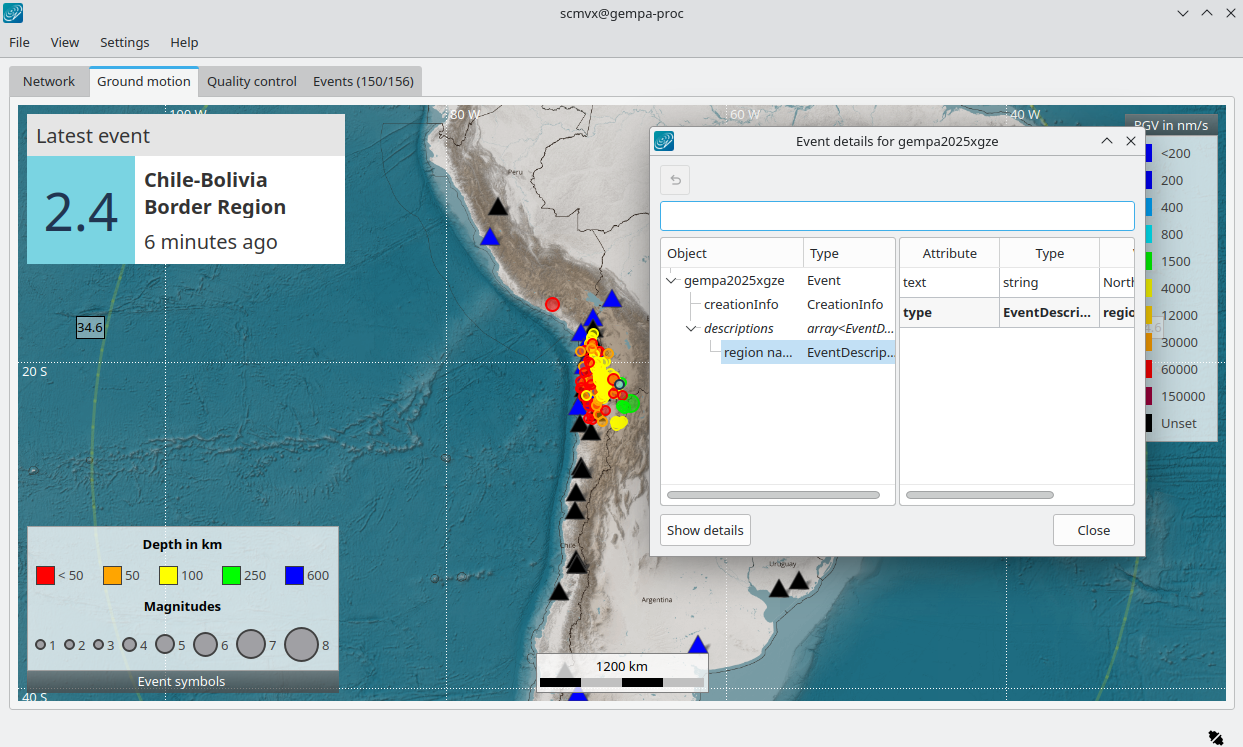
Ground motion tab. Clicking on an event symbol (circle) opens the object inspector in which the event details can be read.
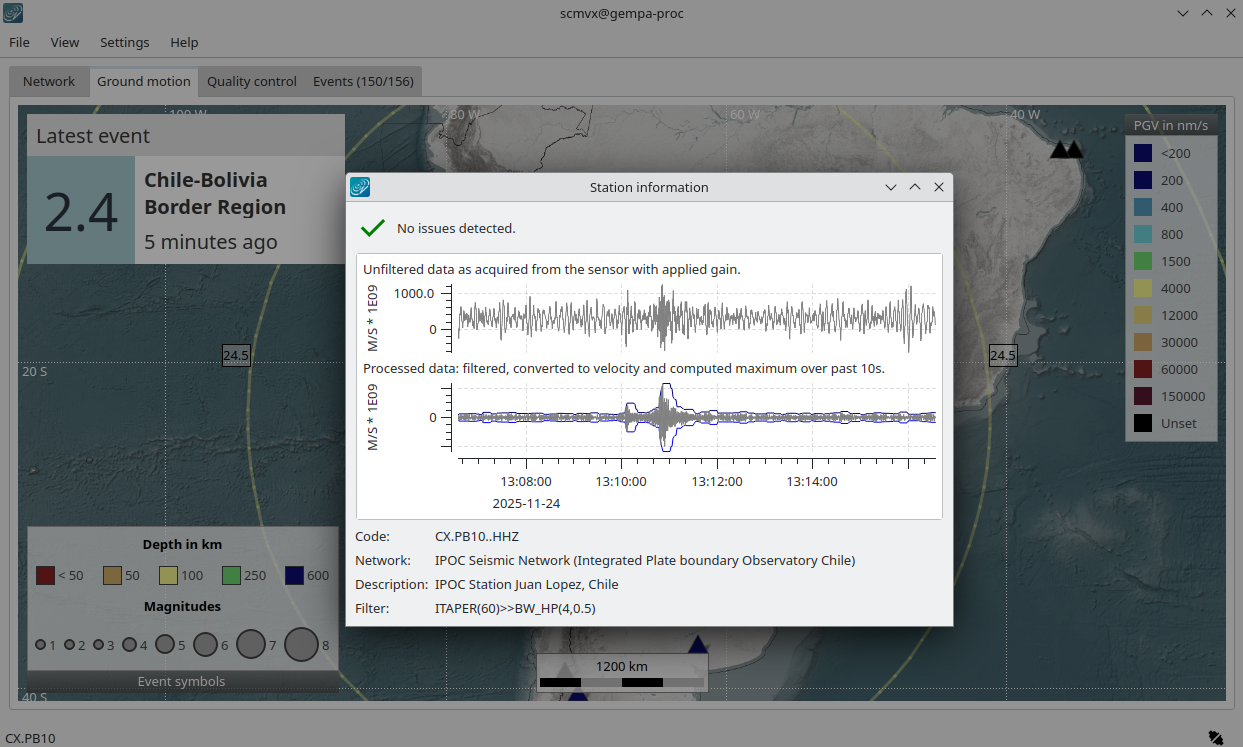
Ground motion tab. Clicking on a station symbol (triangle) opens the details view in which station details and waveforms can be read.
Quality control
The quality control tab shows current waveform QC parameters as computed by scqc which must be running for showing the values.
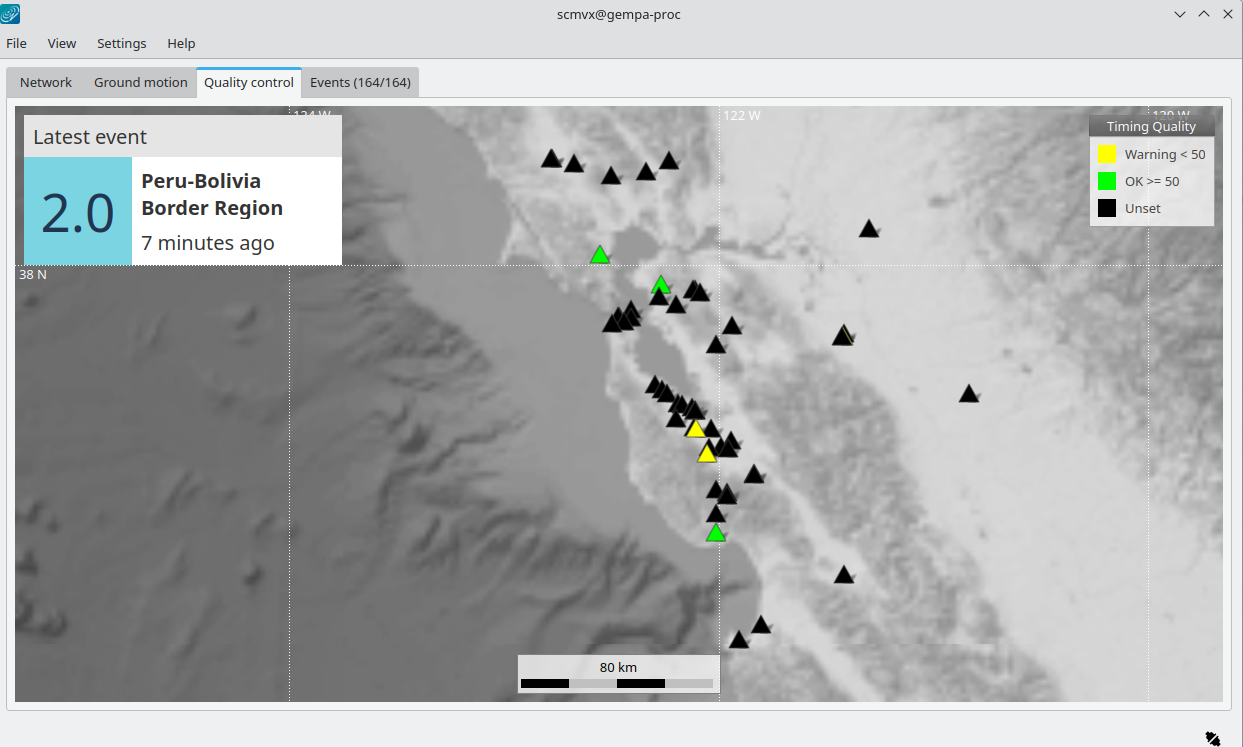
Quality control (QC) tab. The QC parameter type may be selected in the View menu. Here, the maps are greyed out interactively (G).
Events
Events are shown as they arrive in real time and may be interactively loaded
from database and filtered thereafter in the Events tab.
During startup events from within a period of time are loaded and shown
according the configuration of readEventsNotOlderThan.
More events are added in real time as they arrive.
Historic events can be loaded from database for time spans and other filter
criteria.
The loaded events can be sorted interactively by clicking on the table header.
Events out of scope can be hidden based on region, event type or agency ID.
In contrast to other event lists, e.g. in scolv or scesv, this
event list only gives access to parameter of the preferred but no other origins
of events.
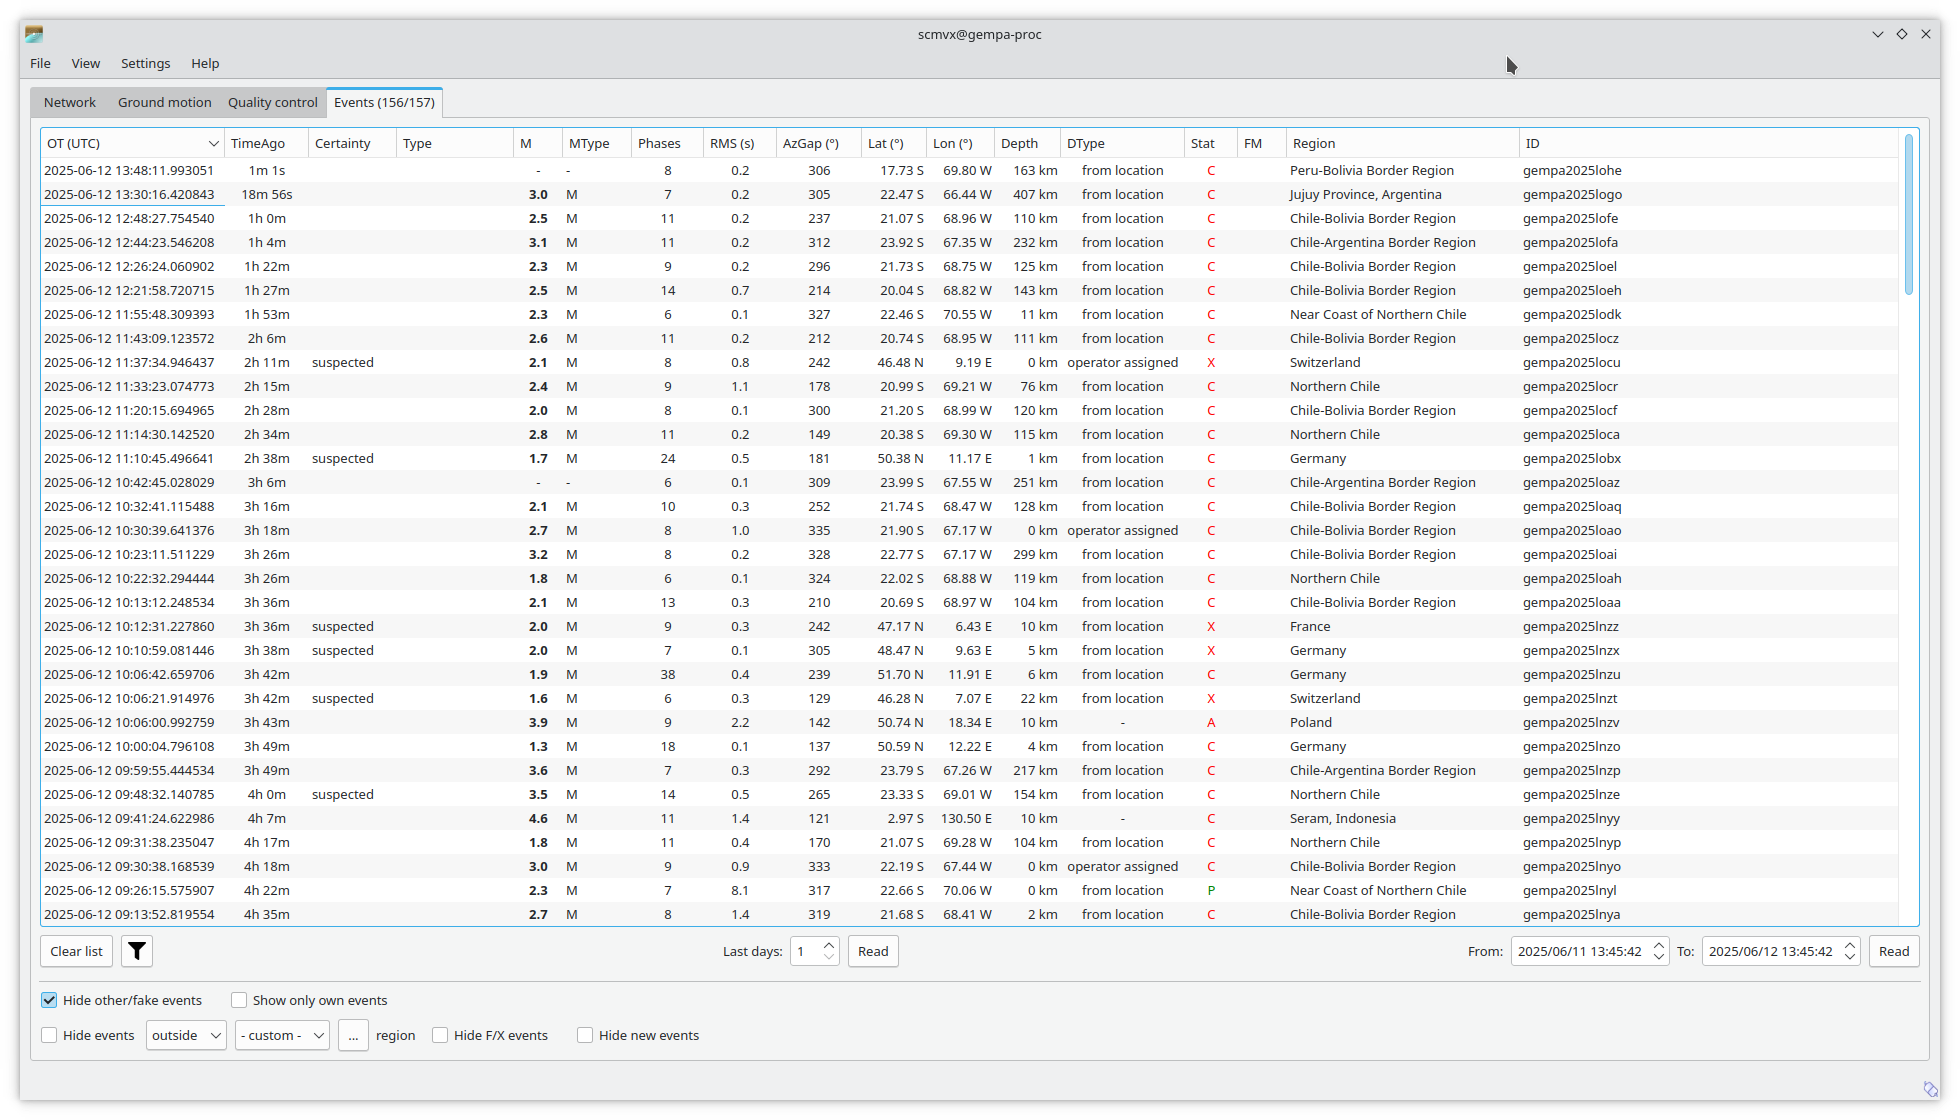
Events tab with events loaded from database and updated in real time.
Hotkeys
Hotkey |
Description |
|---|---|
C |
Center map around latest event upon event update |
G |
Show map base layer in gray scale |
F1 |
Open SeisComP documentation in default browser |
Shift + F1 |
Open scmvx documentation in default browser |
F2 |
Open dialog for connecting to database and messaging |
F6 |
Toggle latest event information on map |
F7 |
Toggle legend |
F8 |
Toggle station issues in Network tab |
Shift + F8 |
Toggle stations without global bindings |
F9 |
Toggle station annotation |
F10 |
Switch to event list (Events tab) |
F11 |
Toggle full screen mode |
Ctrl + F |
Search station |
Ctrl + N |
Reset view to default |
Ctrl + O |
Open event parameter XML file |
Ctrl + Q |
Quit scmvx |
left, right, up, down |
Move focus of map left, right, up, down |
Double mouse click |
Center map |
Mouse wheel |
Zoom in or out in map |
+ |
Zoom in into map around current center |
- |
Zoom out in map around current center |
Shift + Hold left mouse button + Drag |
Select a map area and zoom into it |
Right mouse button |
Open context menu |
Use Cases
Identify networks
Application:
Identify a network on map.
Procedure:
Navigate to the Network tab.
Activate the legend: Right-click on map, select Show legend(s).
Identify all stations by the color of the corresponding network.
Search stations
Application:
Identify a station on map.
Procedure:
Press CTRL + F to open the search window.
Type any string from a station and/or network name in the input field or just select a station from the list.
Double click in a station in the list to center the map at this location.
Get station information, detail issues
Application:
Read station information.
Identify and read station inventory and bindings configuration issues (in Network tab).
View instantaneous waveforms.
Procedure:
Navigate to the Network tab.
Position the mouse above a triangle representing a station. The selected station is highlighted. Zoom in if stations are overlapping.
Click your left mouse button for opening the station info widget. Data and potential configuration issues are shown.
Search for and show an event
Application:
Browse event catalogs in SeisComP database.
Search the list of loaded events.
Procedure:
Navigate to the Events tab load events from database in a relevant time range. You may narrow down the database search through the filter button. After events are loaded the list may be limited by hiding irrelevant events and you may change the sorting of the event table by clicking on the header.
Identify the event and double-click on the event line to load the parameters. You will immediately switch to a map centered around the selected event.
Get event information
Application:
View event details.
Send origin information to other applications, e.g., scolv for further processing.
Procedure:
Position the mouse above a circle representing the location of an event. Zoom in if events are overlapping.
Click the left mouse button for opening the event object inspector.
Click on Show details for sending the origin to the messaging for further processing, e.g., by scolv.
Set artificial origin
Application:
Identify an event of interest, e.g., by blinking stations.
Send origin information to other applications, e.g. scolv for further processing from scratch.
Procedure:
Position the mouse in the map.
Press the middle mouse button.
Set date & time and latitude, longitude & depth.
Press “Create” to open the origin in another GUI, e.g., scolv which must be running already.
Command-Line Examples
Real-time view of events and stations on a local server
scmvx -H localhost -I slink://localhost --debug
Offline view of event parameters given in an XML file. Inventory is read from database.
scmvx -d localhost -i events.xml --debug
Module Configuration
etc/defaults/global.cfgetc/defaults/scmvx.cfgetc/global.cfgetc/scmvx.cfg~/.seiscomp/global.cfg~/.seiscomp/scmvx.cfgscmvx inherits global options.
- displaymode
Default:
networkType: string
Values:
groundmotion,network,qualitycontrolSet one of the available display modes used during startup for defining which tab is shown. When empty, the Network tab is shown.
- readEventsNotOlderThan
Default:
86400Type: double
Unit: s
Sets the time span before current time to read events initially from database.
- centerOrigins
Default:
falseType: boolean
If a new origin/event is set/selected, this option defines if the map is centered or not at the origin location.
- annotations
Default:
falseType: boolean
Enables/disabled drawing of station annotations at startup.
- annotationsWithChannels
Default:
trueType: boolean
Show full stream codes with station annotations including location and channel codes as NET.STA.LOC.CHA.
- showUnboundStations
Default:
trueType: boolean
Enable/disable drawing of stations which are not bound with global bindings.
- mapLegendPosition
Default:
toprightType: string
Values:
topleft,topright,bottomright,bottomleftThe legend location for station symbols (network, QC, ground motion).
- eventLegendPosition
Default:
bottomleftType: string
Values:
topleft,topright,bottomright,bottomleftThe legend location for event symbols.
- stations.amplitudeTimeSpan
Default:
10Type: double
Unit: s
Time span for forming the maximum value as envelope to the traces in the trace window for a station.
- stations.groundMotionRecordLifeSpan
Default:
600Type: double
Unit: s
Time to keep waveform data in memory.
- stations.triggerTimeout
Default:
900Type: double
Unit: s
Time span to show phase picks of a station by a blinking triangle.
- stations.triggerFrameSize
Default:
3Type: int
Unit: px
The size of the frame of a station symbol if in trigger mode.
- stations.groundMotionFilter
Default:
ITAPER(60)>>BW_HP(4,0.5)Type: string
Sets the filter applied to determine ground motion.
Note
display.* The initial rectangular region for the map. The eventual region is also scaled to the dimension of the opened map widget.
- display.latmin
Default:
-90.0Type: double
Unit: deg
Range:
-90:90Minimum latitude in degrees.
- display.lonmin
Default:
-180.0Type: double
Unit: deg
Range:
-360:360Minimum longitude in degrees.
- display.latmax
Default:
90.0Type: double
Unit: deg
Range:
-90:90Maximum latitude in degrees.
- display.lonmax
Default:
180.0Type: double
Unit: deg
Range:
-360:360Maximum longitude in degrees.
Command-Line Options
scmvx [options]
Verbosity
- --verbosity arg
Verbosity level [0..4]. 0:quiet, 1:error, 2:warning, 3:info, 4:debug.
- -v, --v
Increase verbosity level (may be repeated, e.g., -vv).
- -q, --quiet
Quiet mode: no logging output.
- --component arg
Limit the logging to a certain component. This option can be given more than once.
- -s, --syslog
Use syslog logging backend. The output usually goes to /var/lib/messages.
- -l, --lockfile arg
Path to lock file.
- --console arg
Send log output to stdout.
- --debug
Execute in debug mode. Equivalent to --verbosity=4 --console=1 .
- --log-file arg
Use alternative log file.
- --print-component arg
For each log entry print the component right after the log level. By default the component output is enabled for file output but disabled for console output.
- --trace
Execute in trace mode. Equivalent to --verbosity=4 --console=1 --print-component=1 --print-context=1 .
Generic
- -h, --help
Show help message.
- -V, --version
Show version information.
- --config-file file
The alternative module configuration file. When this option is used, the module configuration is only read from the given file and no other configuration stage is considered. Therefore, all configuration including the definition of plugins must be contained in that file or given along with other command-line options such as --plugins.
- --plugins arg
Load given plugins.
- --auto-shutdown arg
Enable/disable self-shutdown because a master module shutdown. This only works when messaging is enabled and the master module sends a shutdown message (enabled with --start-stop-msg for the master module).
- --shutdown-master-module arg
Set the name of the master-module used for auto-shutdown. This is the application name of the module actually started. If symlinks are used, then it is the name of the symlinked application.
- --shutdown-master-username arg
Set the name of the master-username of the messaging used for auto-shutdown. If "shutdown-master-module" is given as well, this parameter is ignored.
Messaging
- -u, --user arg
Overrides configuration parameter
connection.username.
- -H, --host arg
Overrides configuration parameter
connection.server.
- -t, --timeout arg
Overrides configuration parameter
connection.timeout.
- -g, --primary-group arg
Overrides configuration parameter
connection.primaryGroup.
- -S, --subscribe-group arg
A group to subscribe to. This option can be given more than once.
- --content-type arg
Overrides configuration parameter
connection.contentType.Default:
binary
- --start-stop-msg arg
Default:
0Set sending of a start and a stop message.
Database
- --db-driver-list
List all supported database drivers.
- -d, --database arg
The database connection string, format: service://user:pwd@host/database. "service" is the name of the database driver which can be queried with "--db-driver-list".
- --config-module arg
The config module to use.
- --inventory-db arg
Load the inventory from the given database or file, format: [service://]location .
- --db-disable
Do not use the database at all.
Records
- --record-driver-list
List all supported record stream drivers.
- -I, --record-url arg
The RecordStream source URL. Format: [service://]location[#type]. "service" is the name of the RecordStream driver which can be queried with "--record-driver-list". If "service" is not given, "file://" is used and simply the name of a miniSEED file can be given.
- --record-file arg
Specify a file as record source.
- --record-type arg
Specify a type for the records being read.
Cities
- --city-xml arg
Type: file
Values:
*.xmlThe path to the cities XML file. This overrides the default paths. Compare with the global parameter "citiesXML".
User interface
- -F, --full-screen
Start the application filling the entire screen. This only works with GUI applications.
- -N, --non-interactive
Use non-interactive presentation mode. This only works with GUI applications.
MapviewX
- --display-mode arg
Overrides configuration parameter
displaymode.
- -i, --input-file file
Load events in given XML file during startup and switch to offline mode.
- --offline
Do not connect to a messaging server and do not subscribe channel data.
- --with-legend
Show the map legends.

