Web-application
The web-application consists of the following perspectives:
The default URL http://localhost:8080/shard/ launches SHARD in the map view perspective.
The bottom always shows the event information - by default of the latest event, visible by a black background color and an open lock symbol. The right part contains two time values. The one with red background is the relative origin time (time ago) and the one with gray background is the estimated arrival time at the building, once a building is selected. As soon as an event is selected either via the map view or via the events view, the background color changes to gray and the lock closes (see Event selection).
Map view
The map view shows the configured buildings and their current alert state.
Additionally, it shows all earthquakes (circles) configured by
apps.quakelink within an area and time period configured with, e.g.,
apps.events.lat.min, apps.events.lat.max,
apps.events.lon.min, apps.events.lon.max and
apps.events.timeSpan.
The location of the latest or selected earthquake flashes. Clicking on any earthquake circle automatically selects this event and all others disappear. As soon as an event is selected, the event information at the bottom changes color and the lock closes. To deselect the event, simply click on the lock - the color changes to black, the latest event information shows and all events appear again.
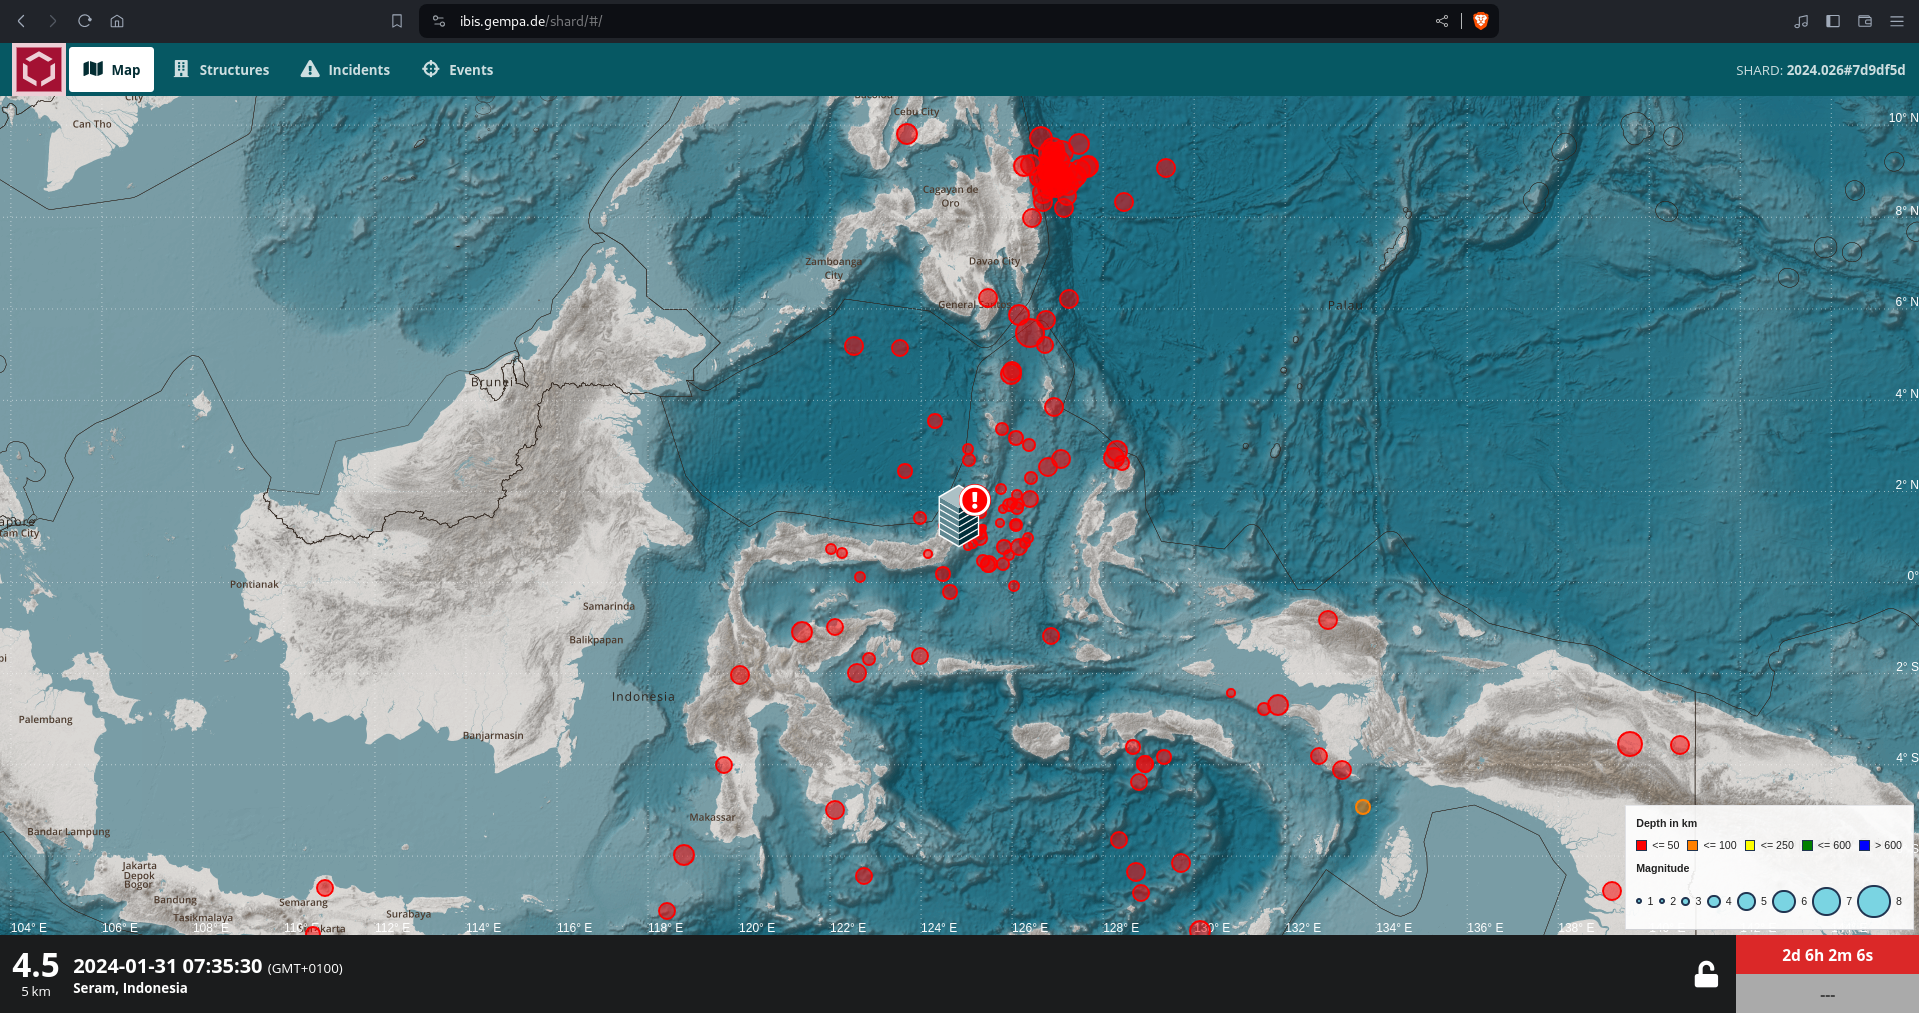
Figure 1: Map view with earthquakes as circles and the building in the center. The bottom shows the most recent event information.
Structures view
The structures view lists all configured buildings. For each building, its current alert states in terms of fragility, shaking, data delay and data quality are color coded. Depending on the parameter, the color is determined differently. In general, the colors can be interpreted as: gray - not calculated, green - no issue, yellow - warning level, red - alert level. Further, each building shows a individual, scrollable list of significant events as well as the latest 6 minutes of monitored PGA.
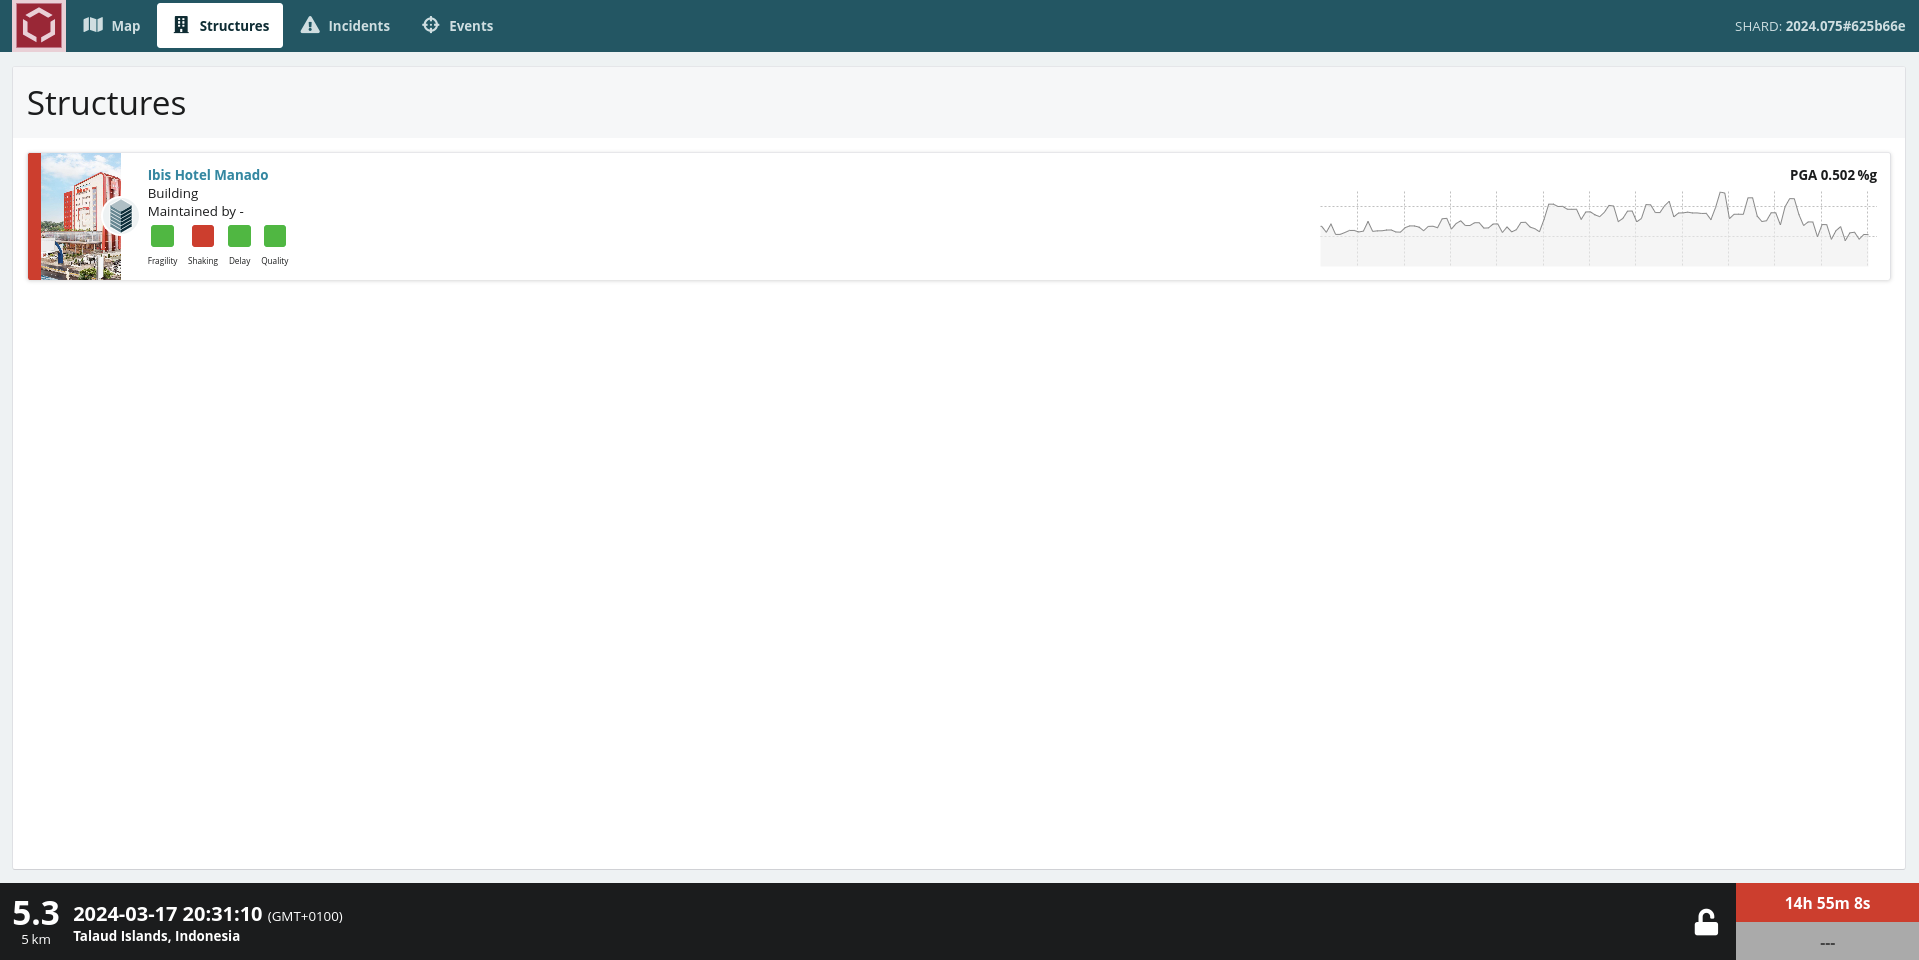
Figure 2: Structure view lists all configured buildings with a quick overview about state, most impactful events and current PGA. Here only one building is configured.
Building view
Clicking on a structure name will open the building specific view. The page is separated in several sub-areas. At the top, the same information of the previous window for the currently selected building is displayed. Below is the information about the building status. If the building is in an alert state, a message is shown and the option to reset its alert states exists, by clicking Clear State. Do this only if you know what you are doing.
The rest of the page is split into a building and incident column on the left-side and the heatmap for the remaining side.
By default, the configurable building picture appears top left, including the
(configurable) sensors locations (drawn as circles). Alternatively, the
structure list can be display by clicking the button with the list symbol. If
configured via building.$name.liveStreams, it is possible to show one
or multiple live streams, simply click the button with the camera symbol and
choose one live stream. Clicking any sensor circles or any sensor list entry
selects and/or deselects a sensor.
Below the building photo are two buttons. PDF, on the left, generates an event report for download, the GDS button will produce the same report but will distribute it via GDS (if configured). Those reports always refer to the current, selected event. To learn more about reports have a look into the Report generation section.
The main portion of the page shows the heatmap which displays the hourly status
of the building regarding any incidents. No incidents within one hour is shown
as green, at least one incident will turn the hour-box red.
If a sensor is selected, the plot is updated to only consider incidents from
that specific sensor. The number of days is configurable with
apps.heatmap.timeSpan, by default the last 7 days are shown.
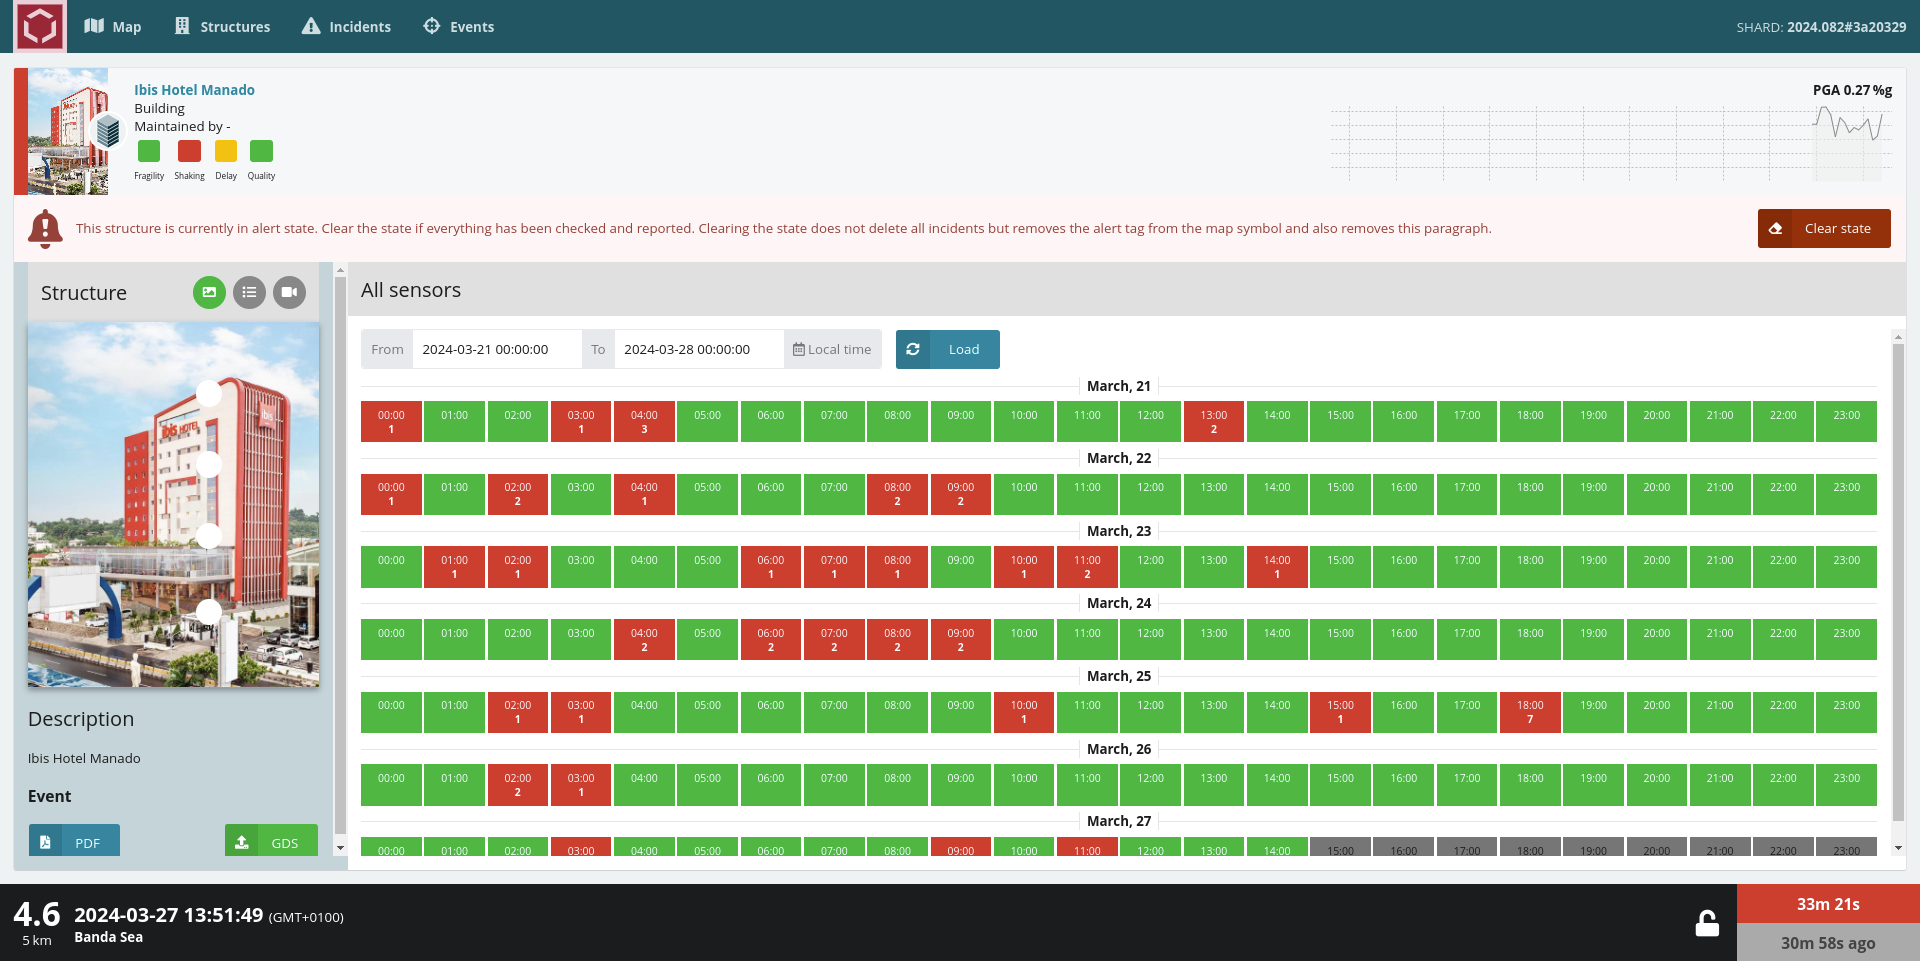
Figure 3: Building view shows the heatmap and position of the configured sensor in the building picture.
Clicking on one of the green or red hour-boxes will display ground motion
information for the selected time window. Either for all configured sensors of
the building or if a sensor is selected, only for that specific sensor. There
are the base channels (PGA), displacement channels, drift channels, response
spectra and fragility plots available, if configured. In the base channels plot
are the (global or building-vise) configurable PGA thresholds
(see AVD configuration) as horizontal lines plotted, the response spectra plot
might show the design spectrum (see Design spectrum) and the fragility
curves (see Fragility curve) might be shown. With the configuration
parameters avd.spec.length and avd.spec.overlap the time
windows for pga, reference spectrum and fragility curve plot are defined. I.e.
each line in the reference spectrum plot represents one time interval.
Below the building picture and the report buttons, all incidents for this building (or sensor) are listed for that specific time-period/hour. Each incident allows to generate a report by clicking on one of the icons at the end, similar to the buttons described before. The difference is that the report is generated for the specific time of the incident.
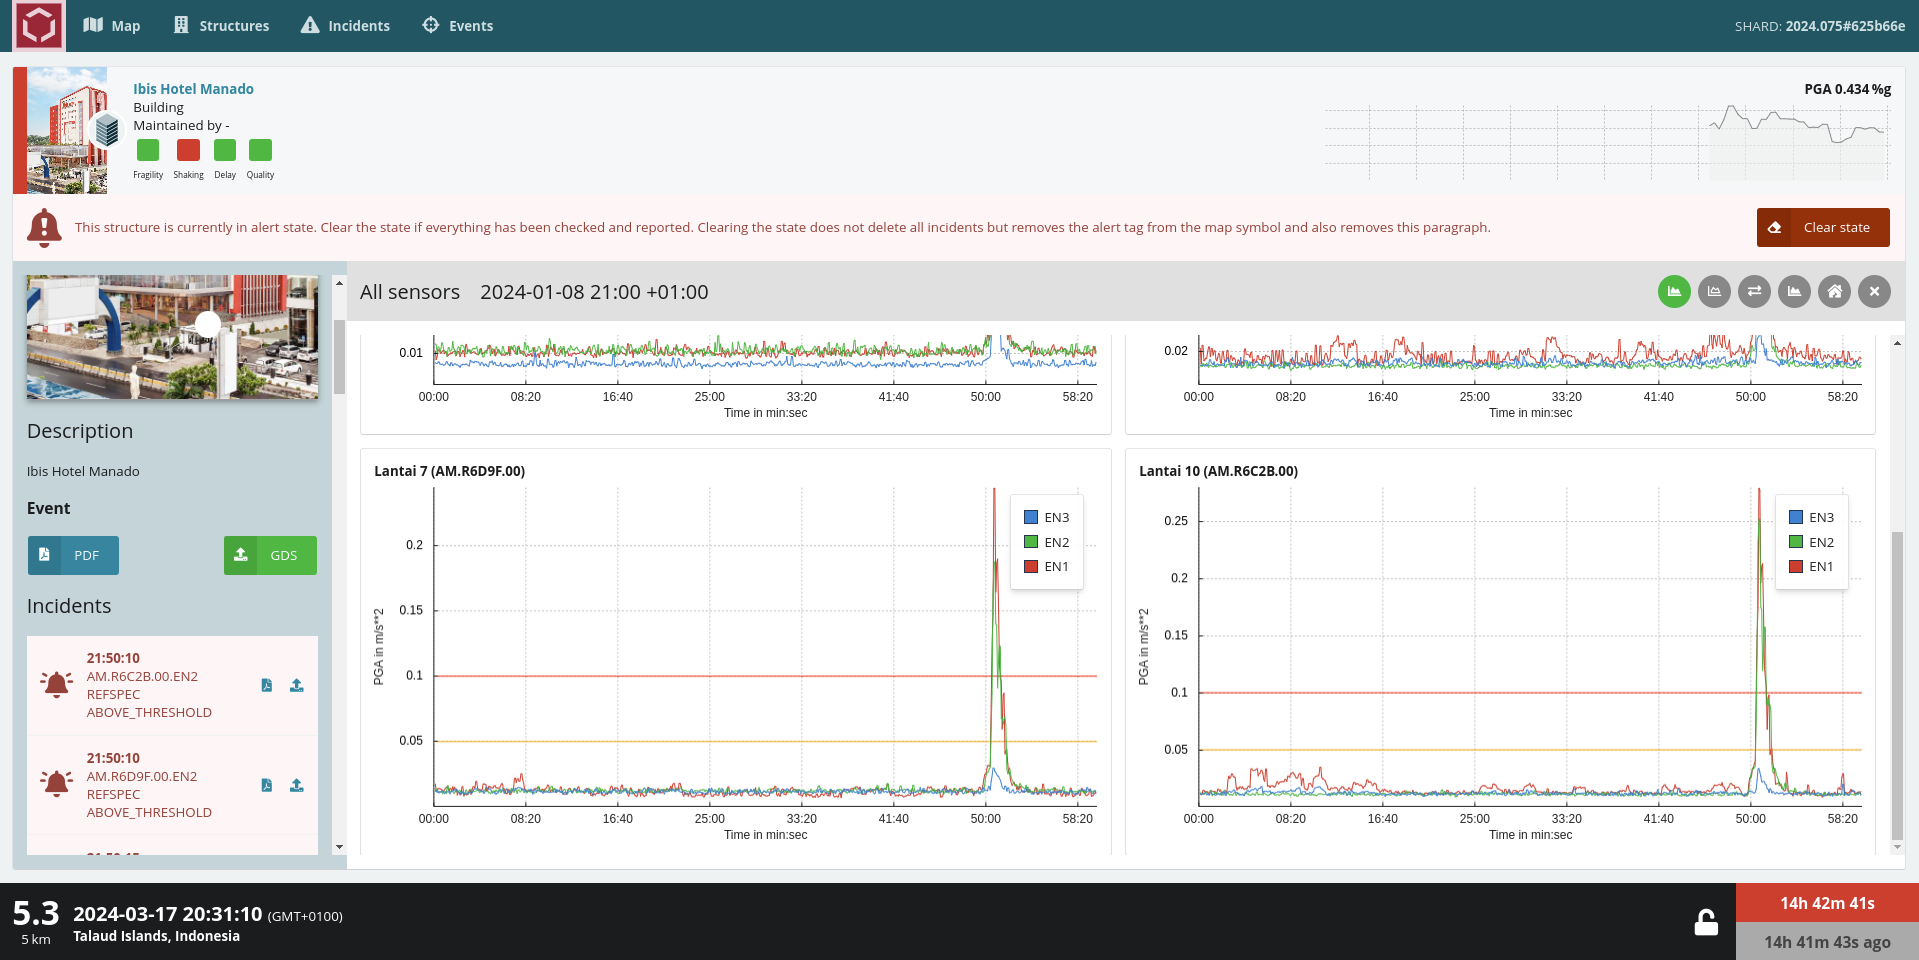
Figure 4: On the left side are the recorded incidents listed, the right shows the PGA curve for each sensor and their configured PGA thresholds as colored horizontal lines.
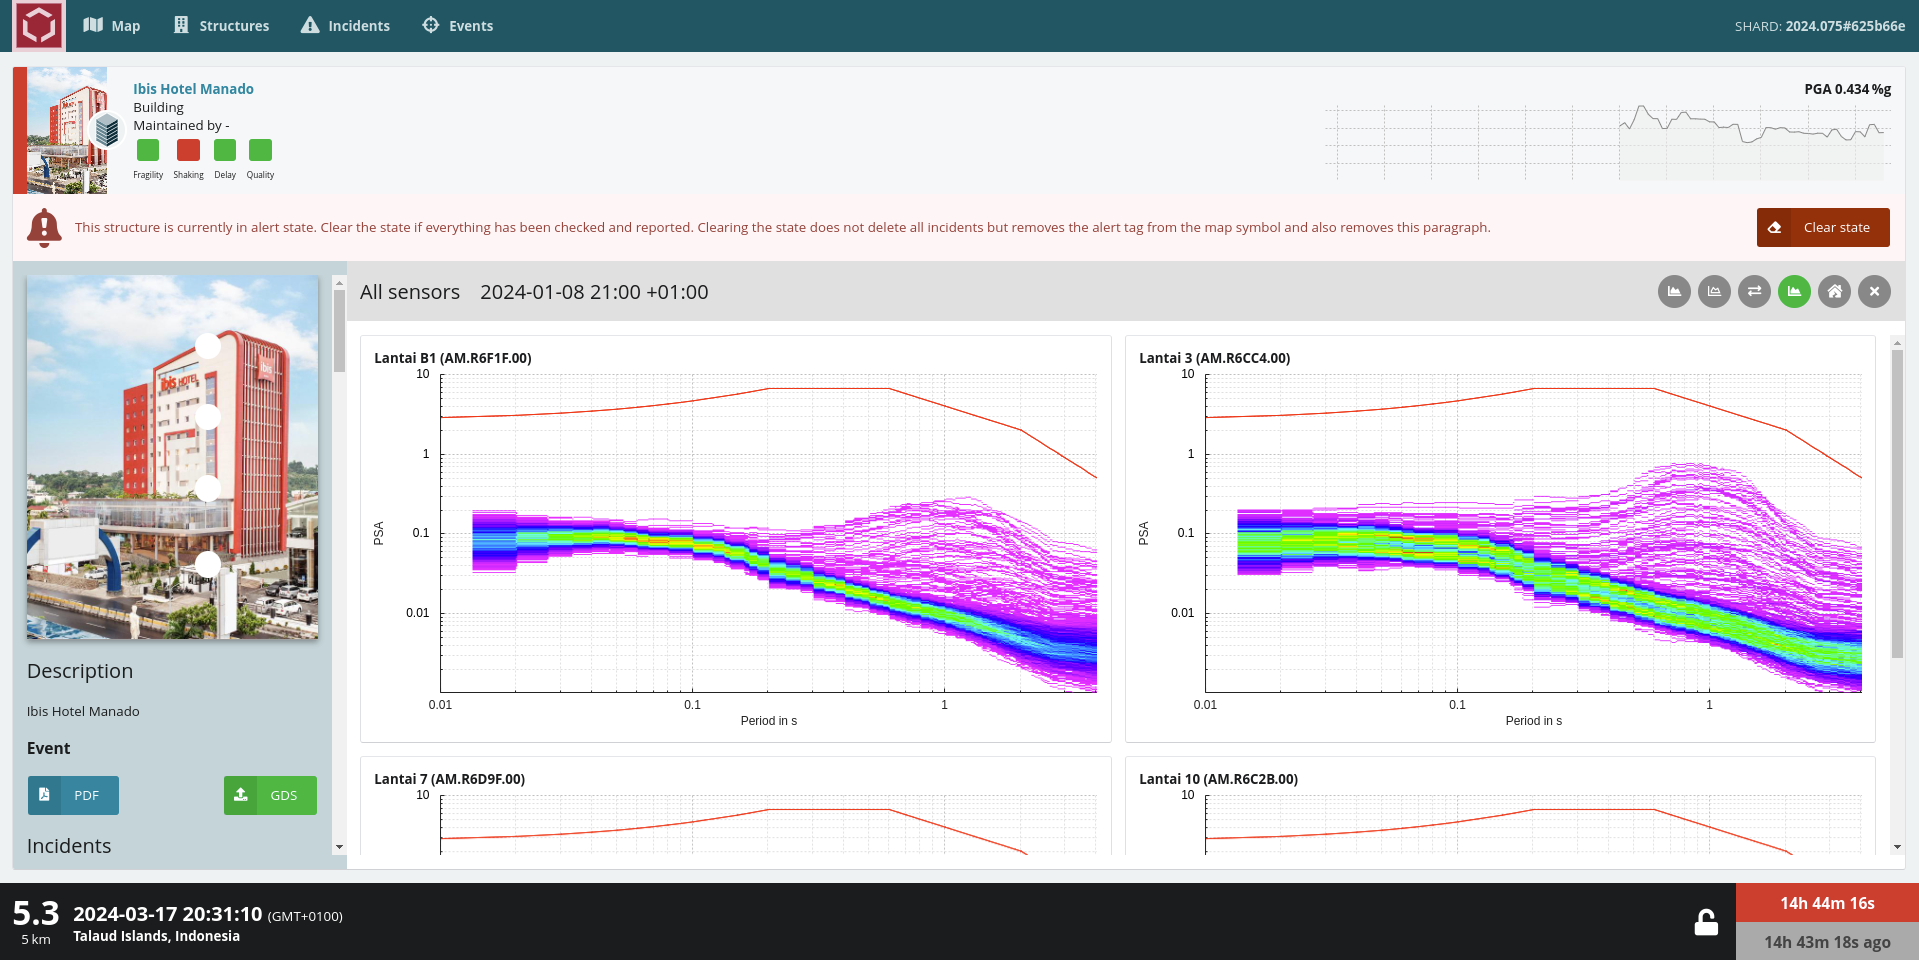
Figure 5: The reference spectrum plot for each sensor with the design spectrum as red line.
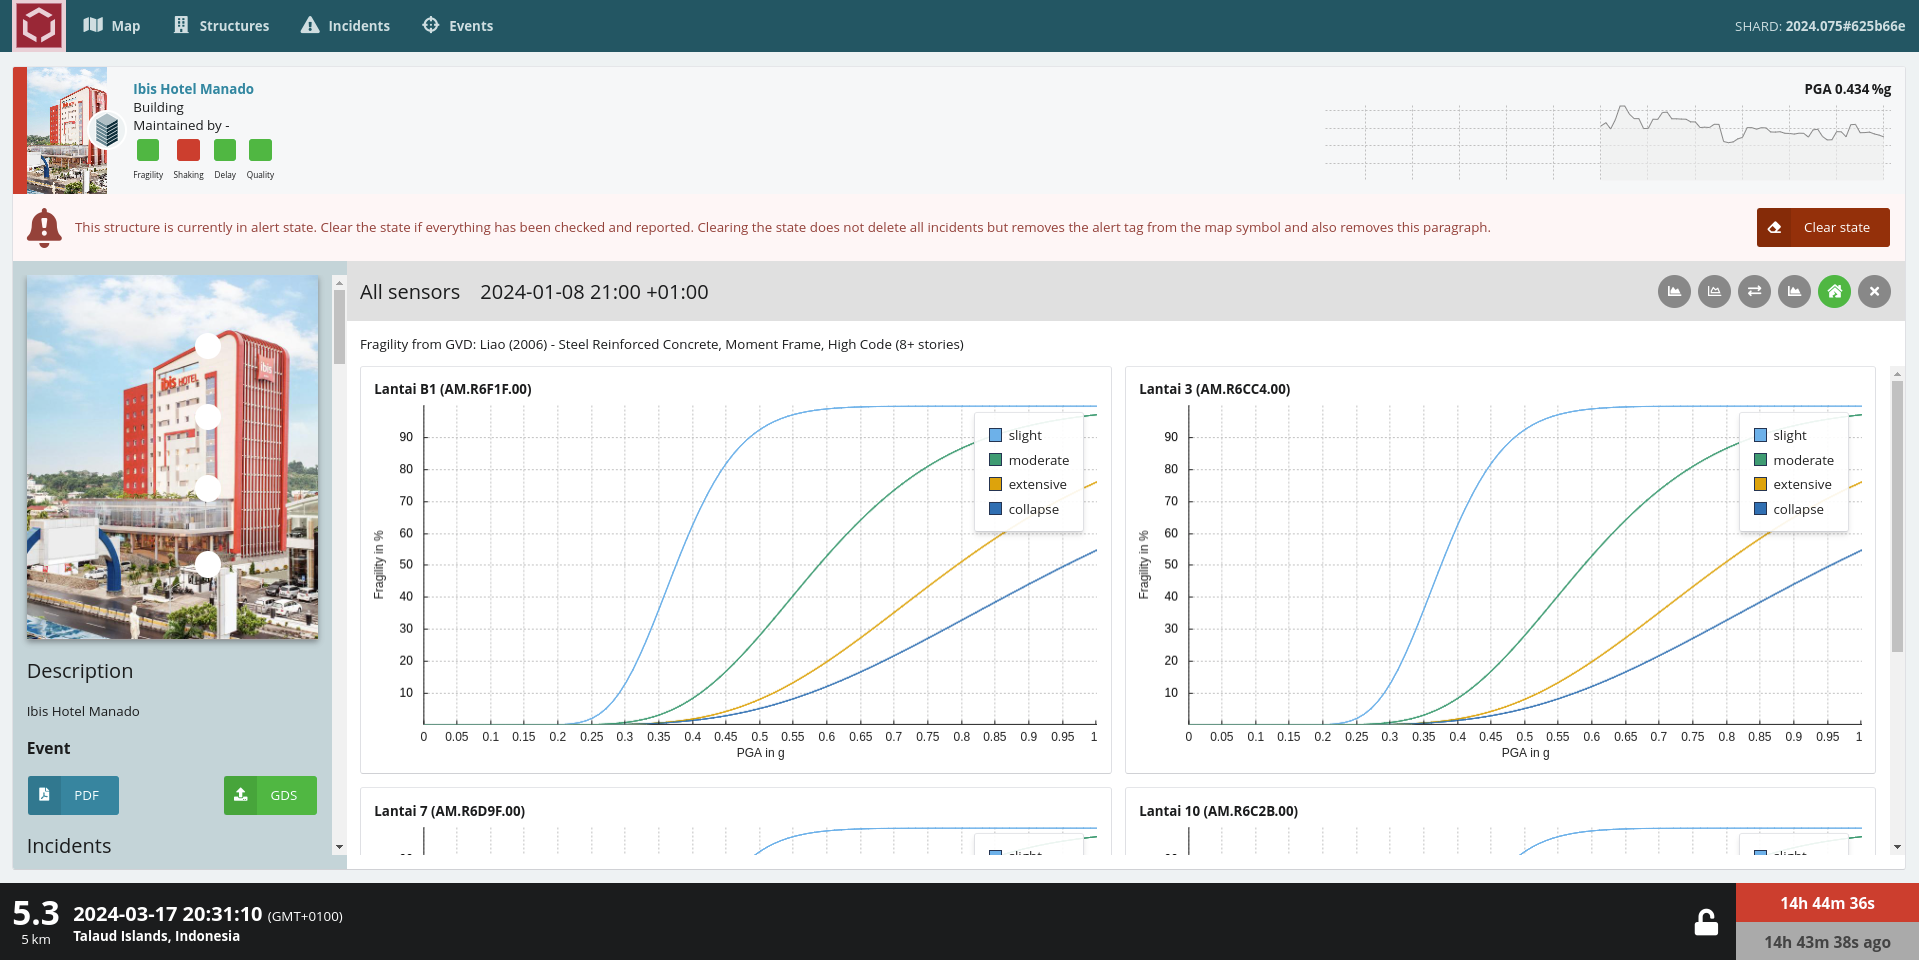
Figure 6: The reference spectrum plot for each sensor with the design spectrum as red line.
Incidents view
The incident view lists SHARD incidents created from analyzing the waveform data such as response spectra exceedance, data quality as well as reported earthquakes. The left side shows the type and reasoning of the incident triggering, while the right side shows the corresponding building and time. Additionally on the right side, the report buttons appear again. Clicking on a station name jumps to the waveform plot of this station for the time of the incident. Filtering for specific building and incident types of the incidents list is available via the filter icon in top right corner of the page.
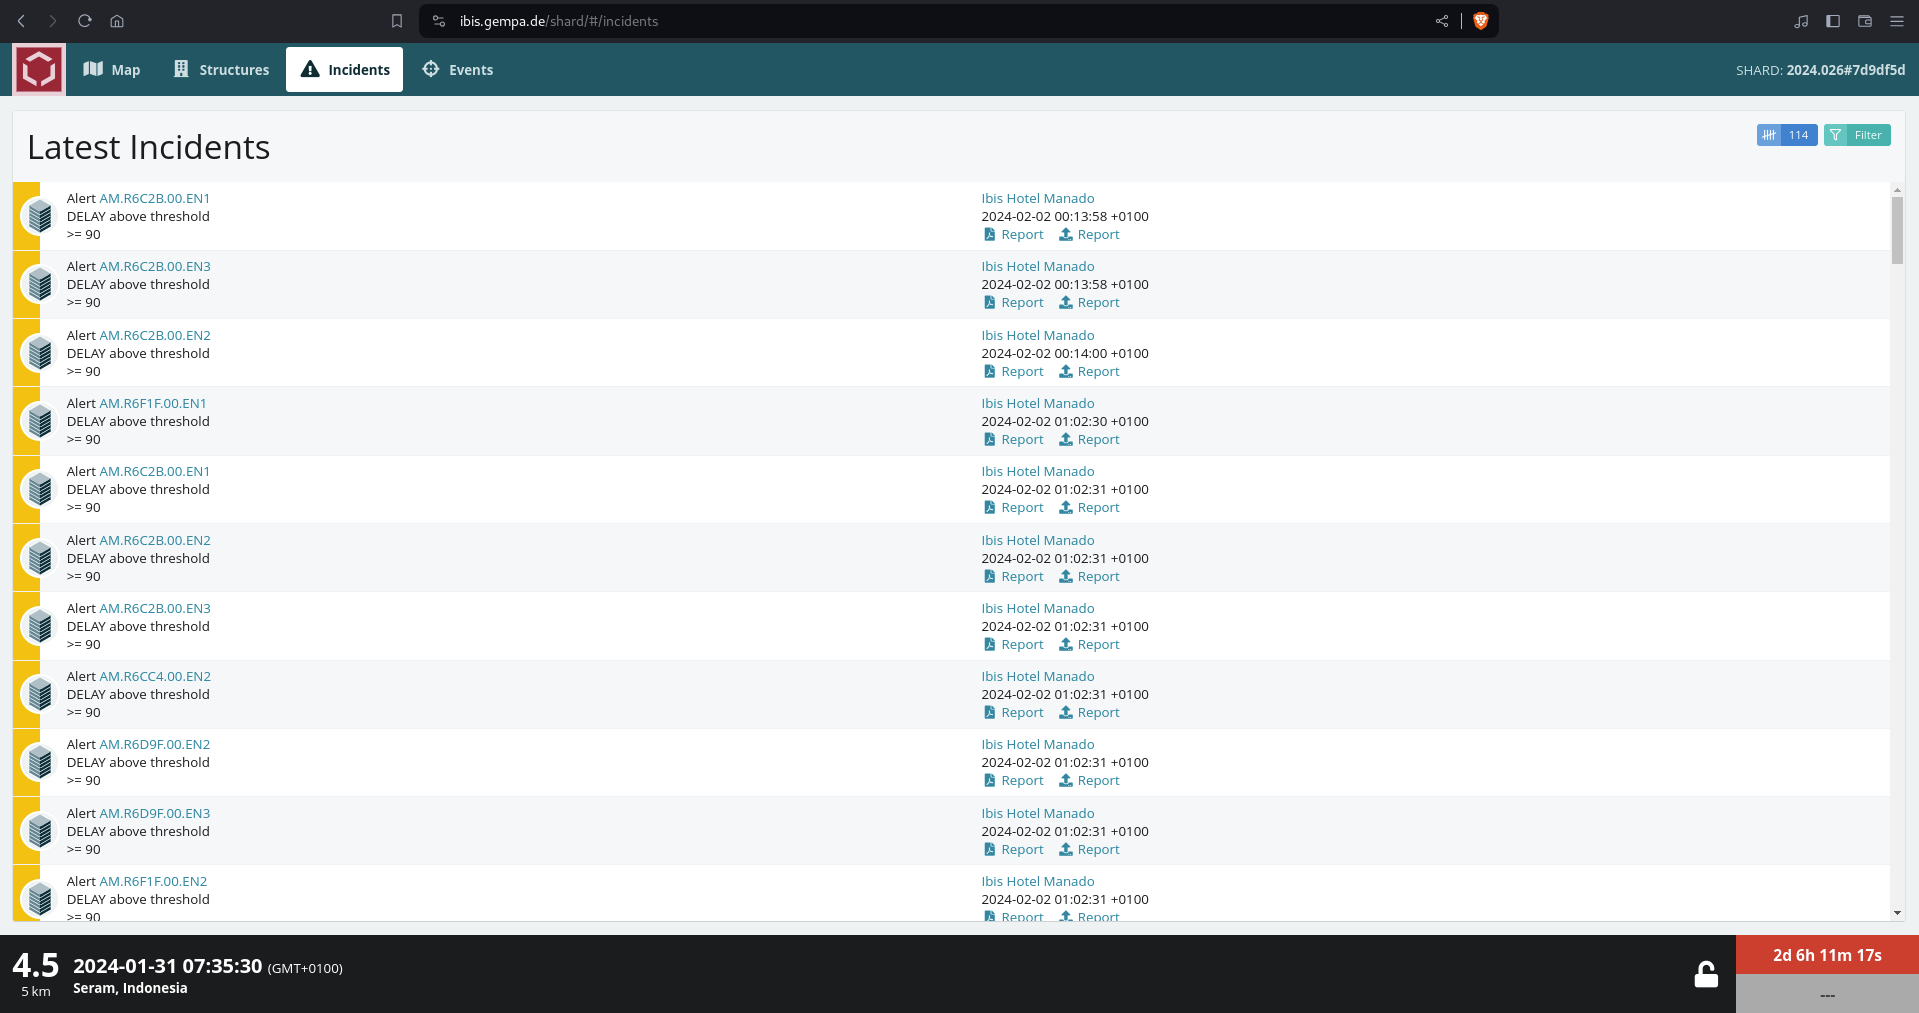
Figure 7: Incident view list the latest recorded incidents and allows to create reports for them.
Events view
The events view lists the latest events and allows for filtering. Clicking on an event will automatically select the event, change the lower event information and jump to the structures tab.
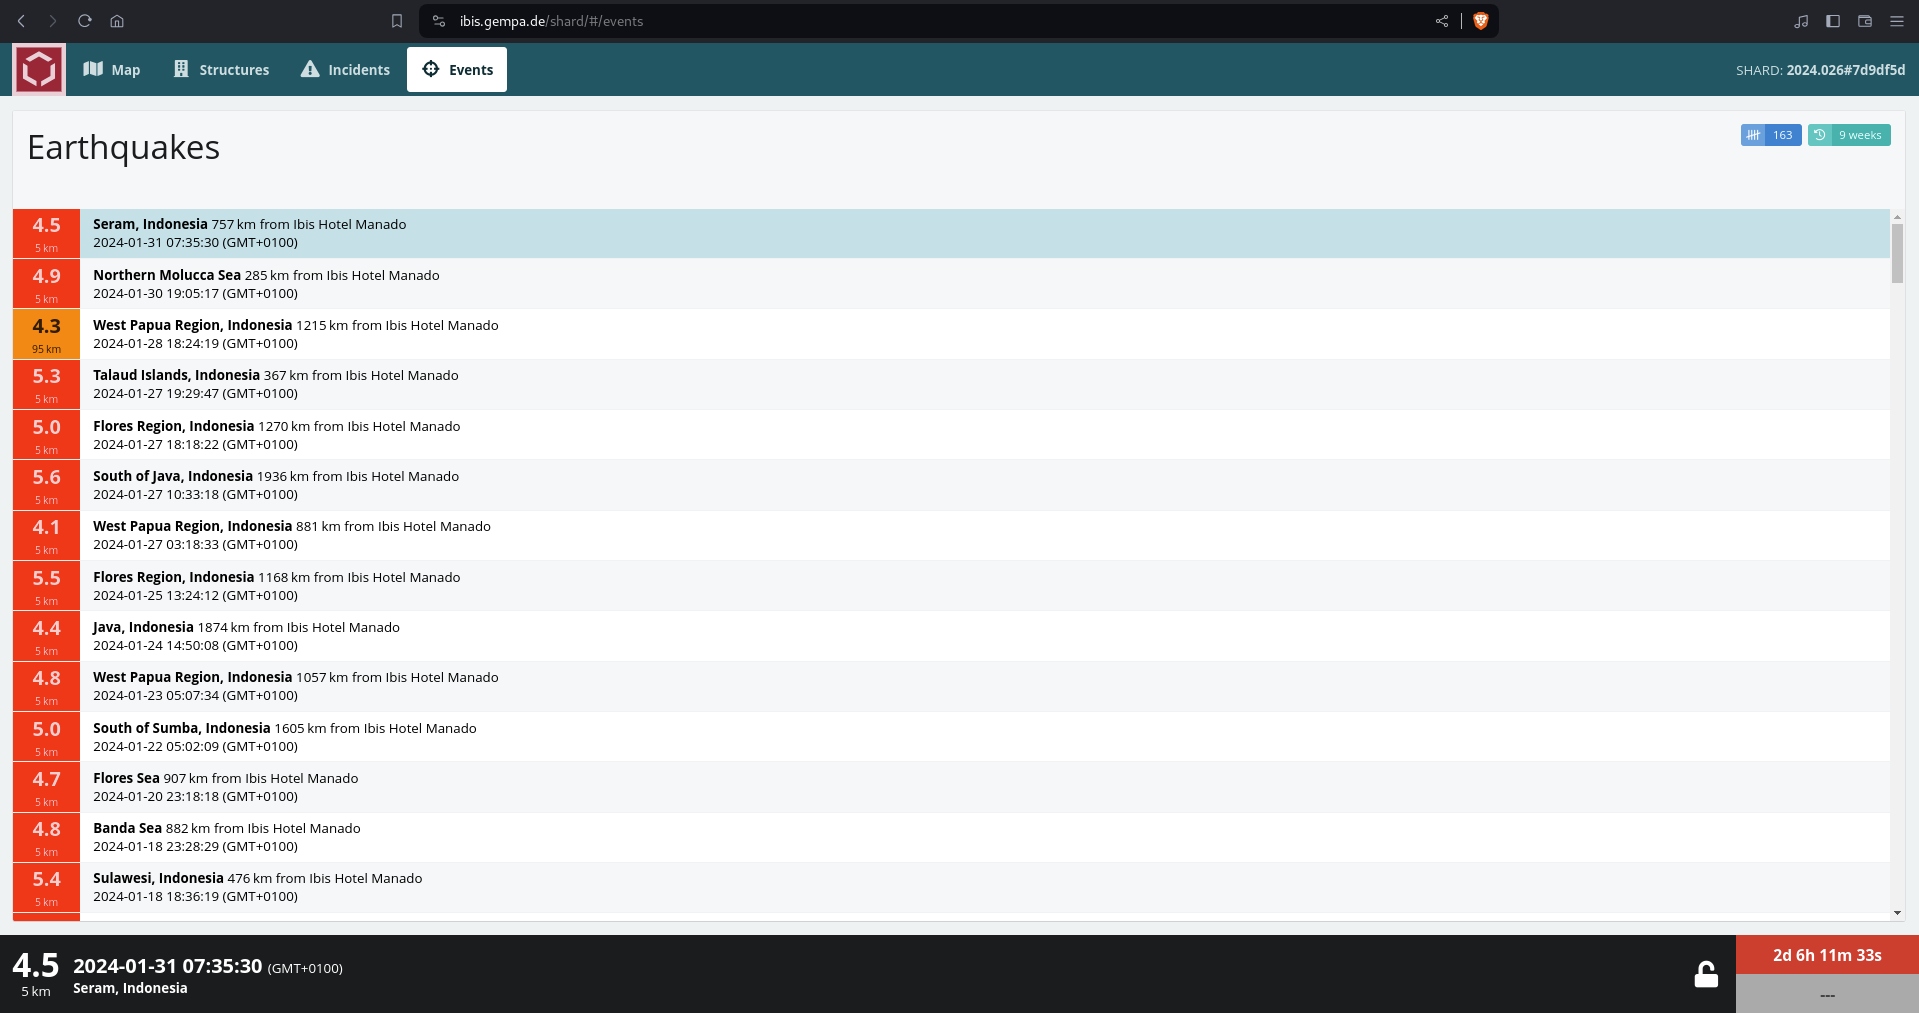
Figure 8: Event view lists the latest events.
Event selection
Clicking on an event circle on the map or selecting an event in the event tab will automatically fix this event. The background color of the lower earthquake information panel changes to gray and the lock closes. Deselect an event by clicking on the lock, the information panel updates to the latest event.
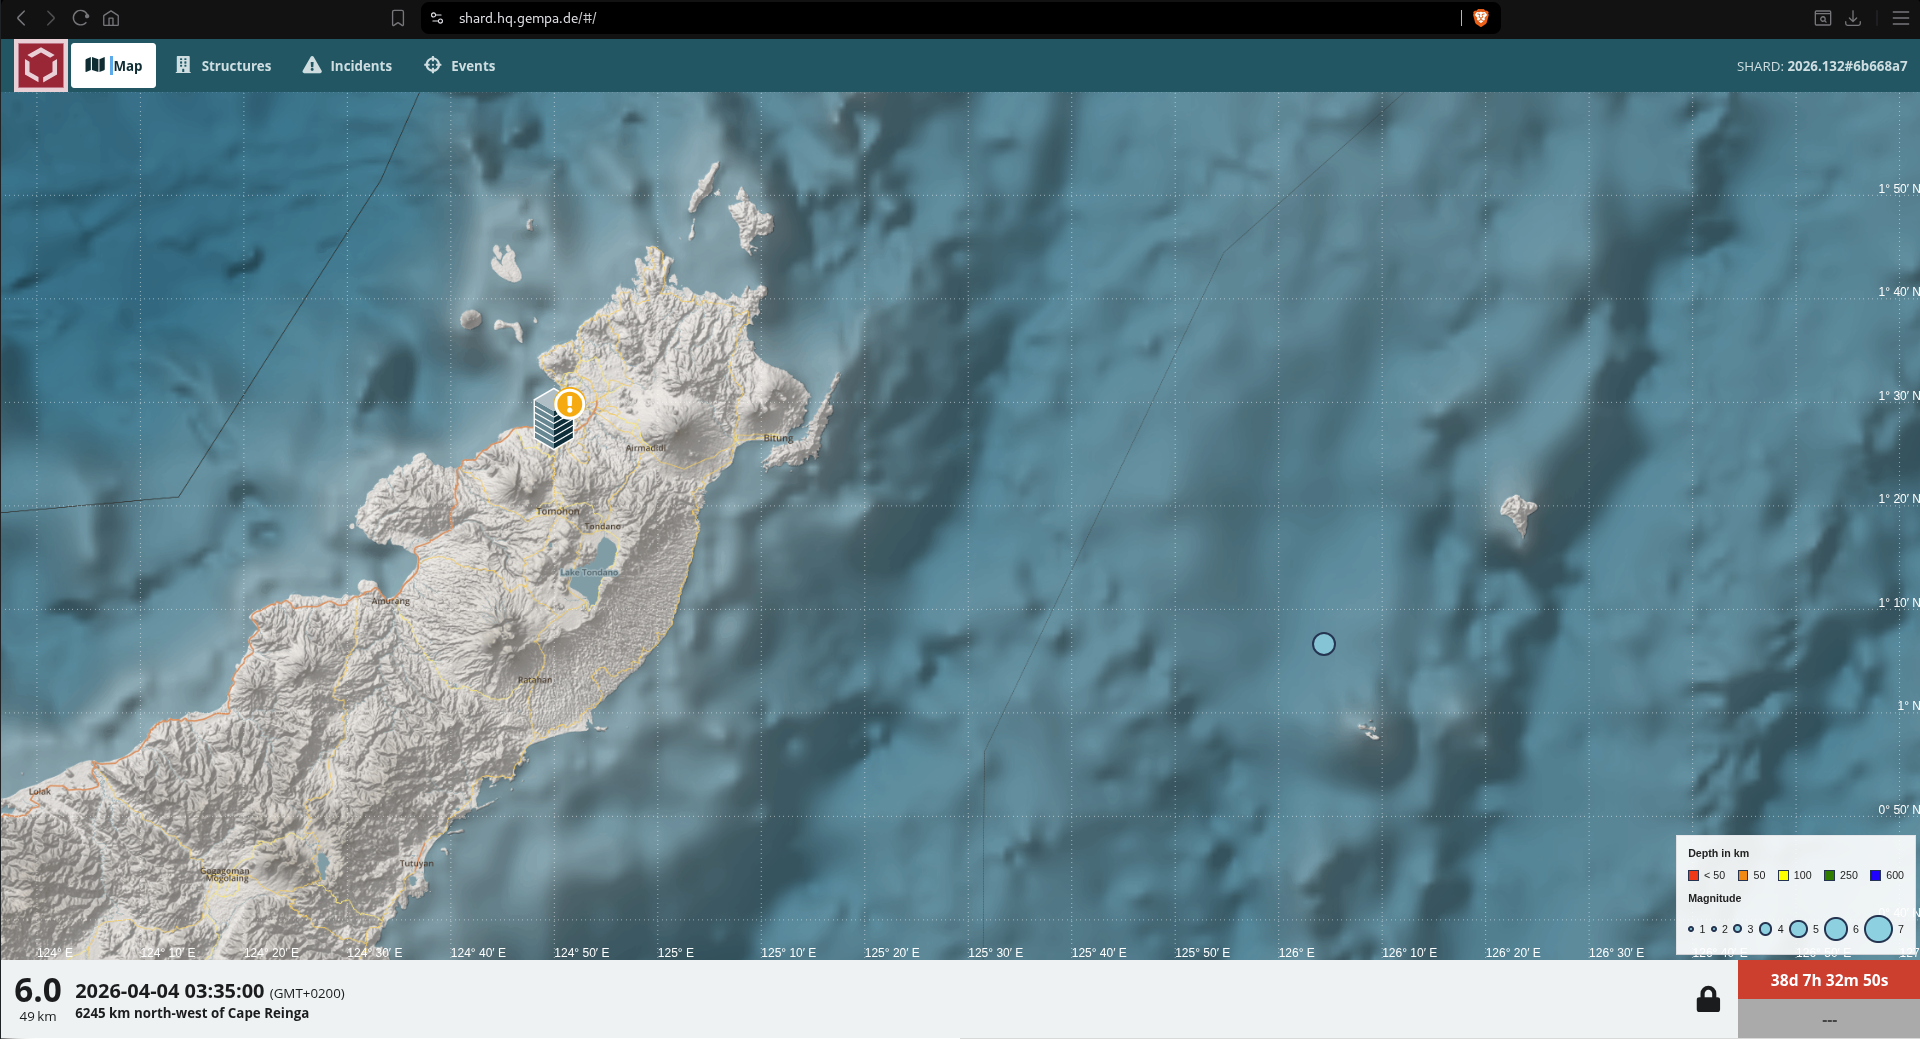
Figure 9: Maps shows the selected event and the changed information panel at the bottom.
If an event is actively selected, clicking on a structure will show only one panel in the heatmap representing the event time. The time filter is disabled.
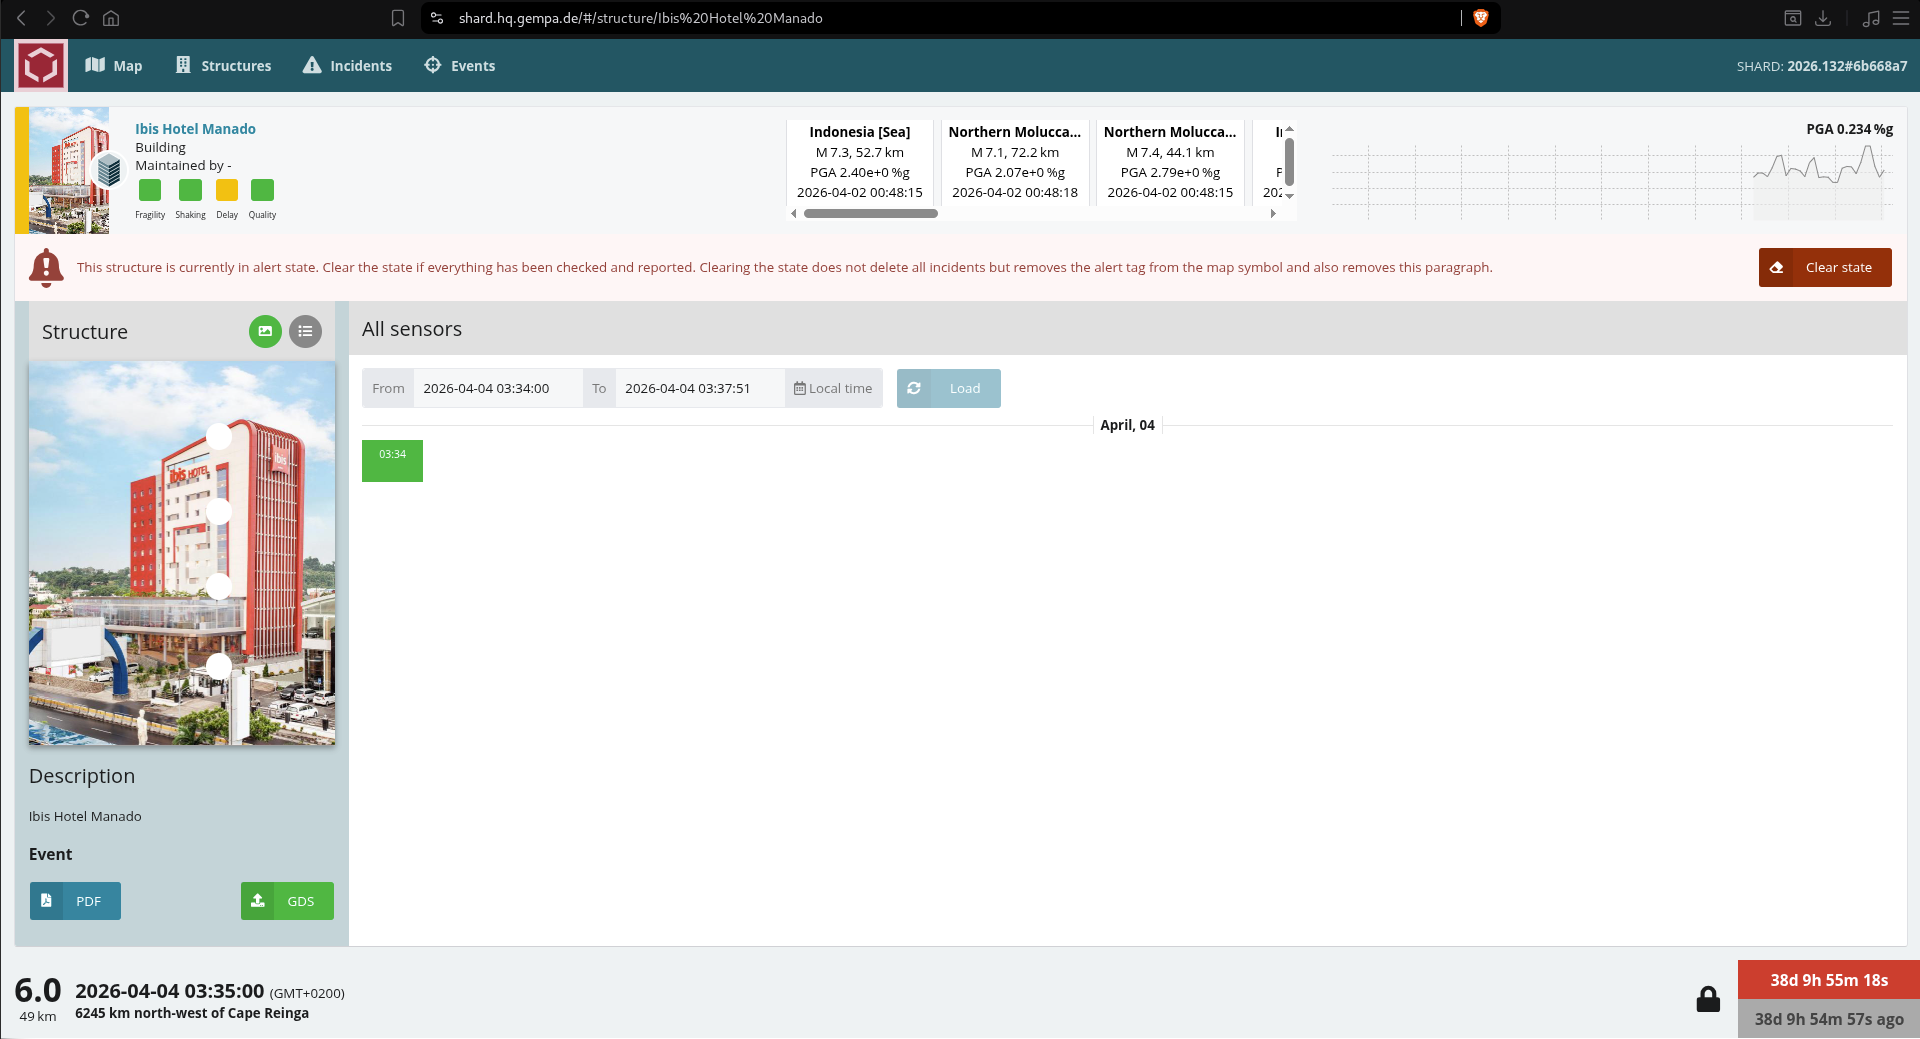
Figure 10: The one and only panel refers to the event time.
Clicking on this panel will display ground motion information as mentioned before. The difference is that the time frame is specific for the event. Starting 60 seconds before event time. The end time depends on the distance (in km) between the structure and the event: endtime = (0.36 * distance) + 120. Hence, at least 180 seconds are displayed.
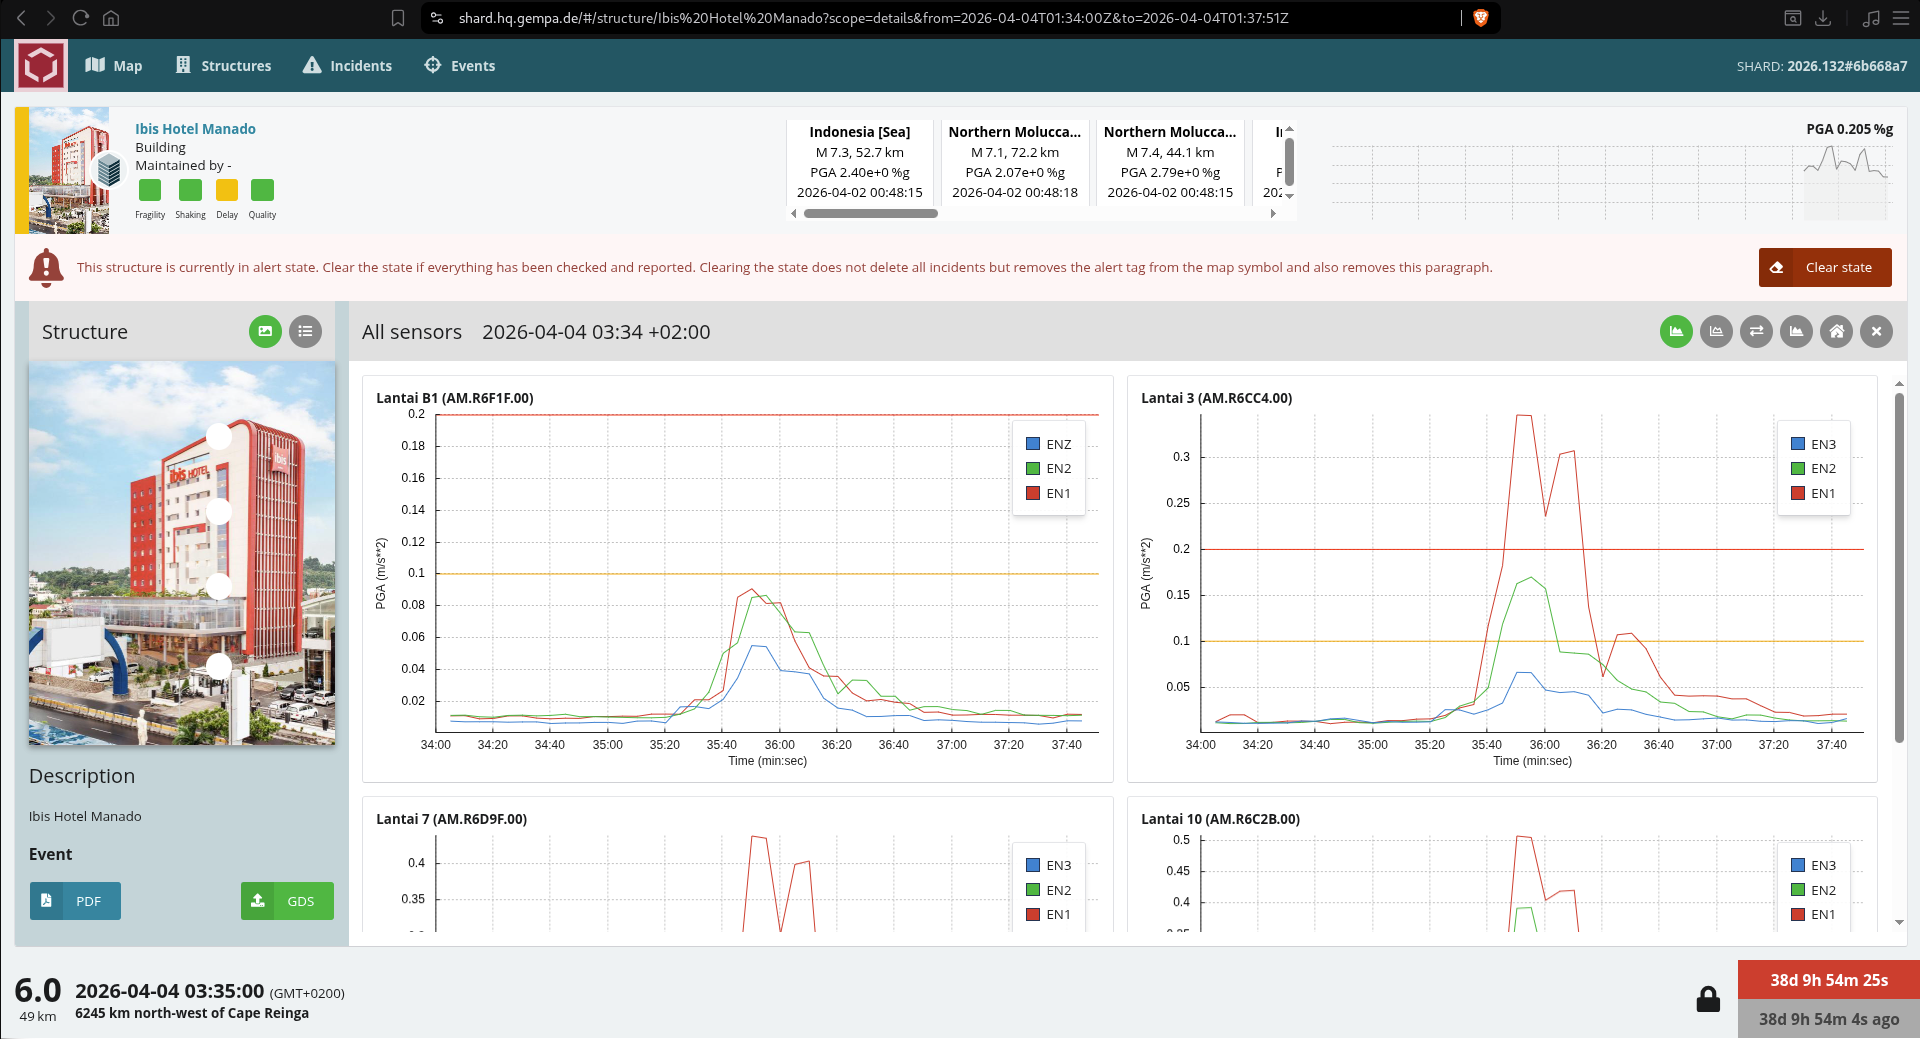
Figure 11: The time window is adjusted to include only the data relevant for the event.
Report generation
SHARD supports the creation of reports, either manually or automatically
triggered. The look and feel of reports can be fully customized by users. Define
with report.exportScript the program to execute the report request.
We would recommend to use the package
report-generators (RGSM),
which is a package designed for customizable report generation, e.g.:
# The script that will be called when an incident is exported. Please ensure
# that the script is executable. The script gets the working directory and the
# language as argument.
report.exportScript = @ROOTDIR@/bin/rgsm
Further, via report.recordStreamURI a recordstream specific for the
report needs to be defined:
# Sets the recordstream URI for report generation. It is important to note that
# this URI should be an archive source that does not block if data are not
# available such as Seedlink. In connection with CAPS the option "arch" should
# be used, e.g. "caps://localhost:18002?arch".

report.recordStreamURI = caps://localhost:18002?arch
Per default, the report and all related files (see list below) are stored under
/tmp/shard-report[ID]. This is just a temporary directory, and will be
removed ather the script run unless report.clean is set to false.
The final report is named incident.pdf and is opened in the same browser
as SHARD.
SHARD provides the following for report.exportScript:
incident.xml - information about the incident
event information
location, origin time, magnitude
creation information
author, agency
processed stream information (per stream)
unit, distances to structure, creation information, waveform stream ID, filter parameters
calculated (strong motion) products:
CAV- Cumulated Absolute Velocity
CI - Characteristic Intensity
EDA - Effective Design Acceleration
Ia - Arias intensity and Ia5%, Ia25%, Ia50%, Ia75% and Ia95%
PGA, PGV, PGD - Peak Ground Acceleration, Velocity and Displacement
SNR - Signal to Noise Ratio
SED - Specific Energy Density
T - Duration
Tp - Predominant period
Tm - Mean period
SA - Frequency dependent (Pseudo) Spectral Accelerations
structure.xml - information about the structure/building
name and description
location (lat/log in degrees)
path to picture on filesystem
configured sensor information (per sensor)
location and elevation
report.desc.xml - additional information for the report
language
triggerMode
map.png - image of the map with plotted building and event location
net.sta.loc.cha-[unit].slist - waveform data as table files for each stream
whereas unit is either acc, vel or disp
net.sta.loc.cha-[unit].spec - spectral data as table files for each stream
whereas unit is either acc, vel or disp
net.sta.loc.cha-[unit]-noise.spec - spectral data of noise as table files for each stream
whereas unit is either acc, vel or disp
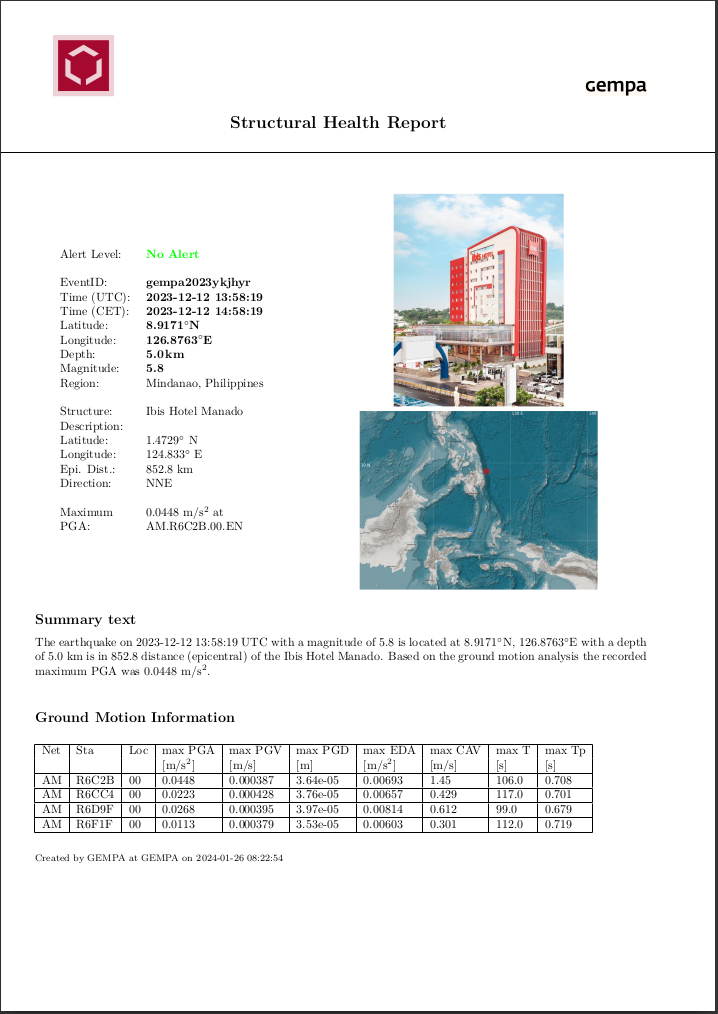
Figure 12: An exemplary event report shown as pdf created with RGSM.
Figure 13: The title page of an exemplary report shown in the browser created with RGSM.
Automatically triggered reports
A reports can be automatically generated and distributed, for instance via
gempa dissemination server (GDS)
or other dissemination services triggered via script.
The report.filter options define its conditions:
If
report.filter.refspecis enabled, reports are generated once the reference/design spectrum is exceeded.If any of
report.filter.pga.alert,report.filter.pga.warning,report.filter.pga.watchare enabled, the generation is triggered once the corresponding threshold is exceeded.Per default, only
report.filter.event.enableis True, which triggers as soon as the configurable MMI threshold at the location of the building is reached.
Internationalization and localization (i18n)
SHARD supports internationalization (i18n) and ships already for English, German, Indonesian and Spanish. Language files are stored in the folder @DATADIR@/shard/assets/i18n. It holds a map of translated items. To adjust your preferences, first click Languages in Chrome settings and input settings (Mac & Linux: Language settings) to open the “Languages” dialog. Add or remove languages from the list, and drag to order them based on your preference. It is important to arrange the order of the available languages.