mapmultigrid
The mapmultigrid plugin allows to plot several grids side by side on one map as map layers. The plugin is provided by the map package. The grids can be generated automatically, e.g. by the gempa module npeval [7]. As soon as the grid file is updated the map will be refreshed by the mapmultigrid plugin and the new grid values are shown. Supported file formats are:
Surfer 6 (binary grids)
GeoTIFF (experimental)
Show grids and legends
Showing grids and corresponding legends on a map is controlled by configuration and by interaction.
To interactively activate or deactivate the configured layer on a map right click on a map and select the layer in the menu section Layers -> multigrid. Here, the layer name is set by configuration, e.g., “multigrid”.
To interactively show the legend for the visible layer on a map right click on a map and select Show Legend(s).
Showing the layers and legends on maps by default may be activated or deactivated in the global configuration or in the configuration of the particular GUI module.
Plotting modes
Different plotting modes are available in the new simplified configuration.
They are defined by the parameter map.multigrid.mode and include:
grid: Plot the grid files without further processing with configurable .,
line: Plot contour lines with configurable line patterns,
poly: Plot filled polygons derived from the grid files based on configured stop levels. Major and minor contour lines may be defined with configurable line patterns as overlays.
Grid shown on a map in grid mode:

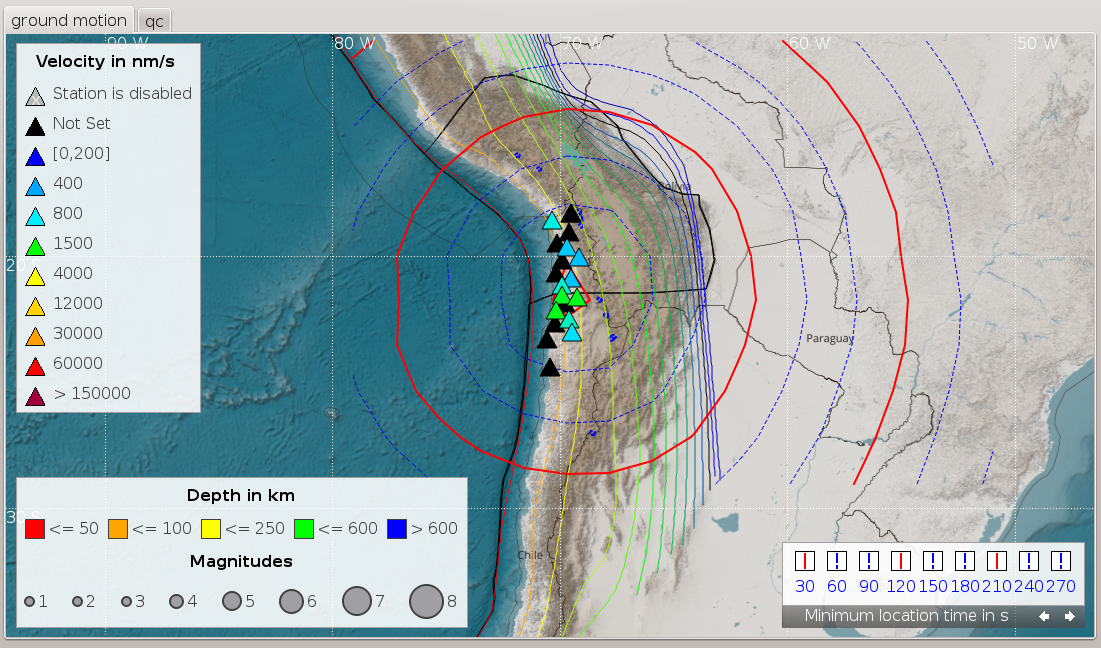
Grid shown on a map as major and minor contour lines using the line mode:
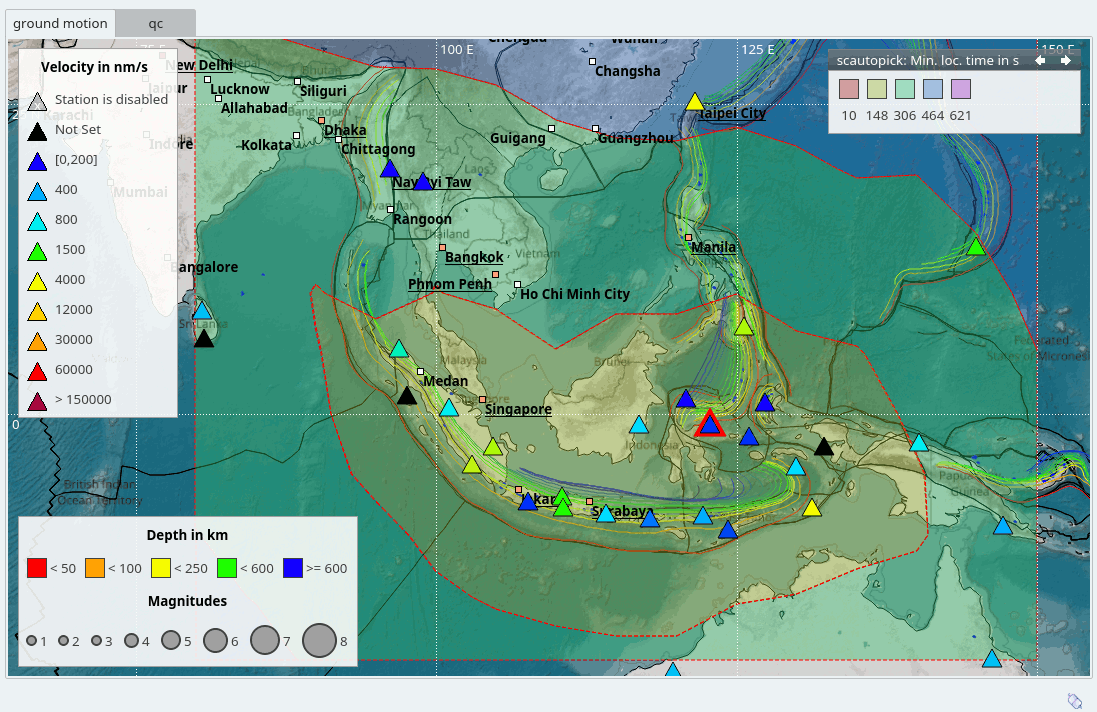
Grid shown on a map as transparent filled polygons using the poly mode:
Setup
The parameters controlling the mapmultigrid plugin are configured in the global
configuration for all modules (global.cfg) or in the global section of
the specific GUI module, e.g. scmv [10] (scmv.cfg). The plugin
supports multiple custom map layers with profiles applied to different grids
with different parameters.
Load the plugin and provide a custom map layer:
plugins = ${plugins},mapmultigrid
Provide a custom map layer:
map.customLayers = multigrid
For each custom layer set the plot mode globally or separately for each grid layer. Globally:
map.multigrid.mode = poly
or for the profile times:
map.multigrid.profiles.times.mode = poly
The grid parameters are either configured
separately for each grid file in one profile with specific parameters,
or for multiple grid in a single profile for sharing parameters, e.g. legend or color configuration.
The configuration of pen and fill colors as well as other attributes may depend on the SeisComP release. Given below are a conventional and a new simplified configuration.
In both cases, the grids parameters are defined by profiles in the global module configuration. The grid profiles must be registered (
map.multigrid.profiles) and defined (map.multigrid.profiles.*). The grid definition contains the parameters controlling grid file, the appearance and the visibility of the grids and the legends. Legends can be shown interactively within the GUIs or by configuring the map properties in the scheme section of the global configuration.Profiles parameters:
watch: Grid file to load. File updates will be considered automatically.Note
The directory hosting the grid file must exist prior to loading maps. If it does not, you must create the directory even if the grid file is generated thereafter.
visible: Make the layer visible during startup. If disabled, the grid is initially invisible but can be activated interactively as a map layer. Right-click on any map and activate a mapmultigrid layer.Grid visualization:
discrete: Activate discrete color intervals. Otherwise the intervals are continuous.composition: Set the composition mode which determines how multiple grids are visualized on top of each other. Possible values are explained in the GUI documentation [1]. The are different from the name scheme defined in QT painter documentation [3]. For an easy mapping, synonyms can be used, e.g. “src-over” and “plus” are identical to “SourceOver” and “Plus”, respectively. Examples:composition = "SourceOver" composition = "src-over" composition = "Plus" composition = "plus"
Default is “src-over” or “SourceOver”. Read QT painter documentation [3] for a complete description of the composition modes.
stops: stop or levels at which the line and fill properties are defined. E.g.stops = 2.00:e483fc50:"minor",2.50:d79cfd50:"major"
In the example, “minor” and “major” are optional style profiles for plotting contours.
Contour lines:
renderBackToFront: order in which the polygons are rendered.style: name of the style profiles as given instops, e.g. major, minor. The styles determine further pen and brush properties for lines and areas of polygons. They are configured by defining style profiles which are registered by thestyleparameter. Styles parameters:Brush (fill) properties, read the GUI documentation [1] for more details:
brush.color: fill color in hexadecimal valuebrush.pattern: brush pattern
Pen (line) properties, read the GUI documentation [1] for more details:
pen.color: line color in hexadecimal valuepen.style: line stylepen.width: line width.
Legend properties, read the GUI documentation [1] for more details:
title: title of the grid as shown in the map legendlegendArea: position of the legend on the map. Supported positions are bottomright, bottomleft, topright, topleft. Example:legendArea = bottomright
Colors, transparency, etc.
Colors are given in rgb or hexadecimal representation. As of SeisComP in version 4.4.0, colors can also be set more human readable color keyword names. Hexadecimal or rgb color tables can be found online. Transparency is defined by adding the alpha value to the color. The alpha value is given by a 2 digit number added to the color. Other pen styles are given in the GUI documentation [1].
Red fill with no transparency bound by a minor contour line at the level of 2.0:
stops = 2.0:ff0000:"minor"
Red fill with 50% transparency bound by a major contour line at the level of 2.0:
stops = 2.0:ff000050:"major"
For the configuration of major and minor contours use brush, pen and gradient properties.
Example configurations
New simplified configuration
In the configuration file the profiles are grouped by curly brackets “{}”. Different plot modes are available. For contour lines, different pen properties of minor and major lines can be defined. The fill properties are defined by stops where the minor and major levels are defined.
Configuration example:
map.customLayers = multigrid

map.multigrid.profiles = magnitude,times
map.multigrid.mode = poly

map.multigrid.styles {

  major.pen.color = FF0000
  major.pen.style = dashline
  major.pen.width = 1

  minor.pen.color = 0000FF
  minor.pen.style = dashline
}

map.multigrid.profiles.times {

  watch = /tmp/npeval/npeval_times.grd
  stops = 30.00:ff00fa:"major",60.00:f25ffb:"minor",90.00:e483fc:"minor",120.00:d79cfd:"major",150.00:c9aefe:"minor"
  visible = true
  renderBackToFront = true
  composition = "src-over"
  title = "Minimum location time in s"
  legendArea = topright
}

map.multigrid.profiles.magnitude {

  watch = /tmp/npeval/npeval_minmag.grd
  title = "Minimum magnitude"
  stops = 2.00:e483fc50:"minor",2.50:d79cfd50:"major",3.00:c9aefe50:"minor",3.50:9fd7ff50:"minor",4.00:93dfff50:"major"
  visible = true
  renderBackToFront = true
  composition = "src-over"
  legendArea = topright
}
Conventional configuration
In the conventional configuration, the fill colors are defined by the gradient
(map.multigrid.profiles.$name.gradient). Properties of contour lines
are given by the stops properties (map.multigrid.profiles.$name.stops).
map.customLayers = multigrid

# grid profiles to consider
map.multigrid.profiles = times, minmag

map.multigrid.mode = poly

# first grid profile
# grid file
map.multigrid.profiles.times.watch = /tmp/npeval/npeval_times.grd

# pen and fill attributes
map.multigrid.profiles.times.gradient = 30.00:ff00fa,60.00:f25ffb,90.00:e483fc

# line attributes
map.multigrid.profiles.times.stops = 30,60,90,120,150,180,210
map.multigrid.profiles.times.stops.pen.style = dotline
map.multigrid.profiles.times.stops.pen.color = ff0000
map.multigrid.profiles.times.stops.30.brush.color = ff00faff
map.multigrid.profiles.times.stops.60.brush.color = f25ffbff
map.multigrid.profiles.times.stops.90.brush.color = e483fcff

# visibility on startup
map.multigrid.profiles.times.visible = false
map.multigrid.profiles.times.renderBackToFront = true
map.multigrid.profiles.times.composition = "src-over"

# legend title
map.multigrid.profiles.times.title = "Minimum location time in s"

# legend position
map.multigrid.profiles.times.legendArea = topright

# second grid profile
# grid file
map.multigrid.profiles.minmag.watch = /tmp/npeval/npeval_minmag.grd

# legend title
map.multigrid.profiles.minmag.title = "Minimum Magnitude"

# legend position
map.multigrid.profiles.minmag.legendArea = topright

# pen and fill attributes
map.multigrid.profiles.minmag.gradient = 2.00:ff00fa,3.00:f25ffb,4.00:e483fc

# visibility on startup
map.multigrid.profiles.minmag.visible = true
map.multigrid.profiles.minmag.renderBackToFront = true
map.multigrid.profiles.minmag.composition = "src-over"
Module Configuration
- map.multigrid.profiles
Type: list:string
Name(s) of ‘mapmultigrid’ profiles to be considered. Separate multiple names by comma.
- map.multigrid.mode
Default:
polyType: string
Render mode of the mapmultigrid plugin. May be overridden per grid profile.
- map.multigrid.profiles.$name.watch
Type: list:string
List of files to be shown and monitored for changes with inotify. Supported file formats are: Surfer 6 (binary grids) and GeoTIFF. The GeoTIFF support is experimental and not all GeoTIFF datatypes are supported. The file extension must be TIFF for GeoTIFF files. Separate multiple files by comma.
The corresponding directory must exist prior to opening maps.
- map.multigrid.profiles.$name.title
Default:
Type: string
The title of the grid legend shown on map.
- map.multigrid.profiles.$name.legendArea
Default:
bottomrightValues:
topleft, topright, bottomright, bottomleftType: string
The location of the grid legend on the map.
- map.multigrid.profiles.$name.legendVisible
Default:
trueType: boolean
Show the legend for this profile.
- map.multigrid.profiles.$name.discrete
Default:
trueType: boolean
Use a discrete gradient is for rendering in grid mode.
- map.multigrid.profiles.$name.mode
Default:
gridValues:
grid, line, polyType: string
Render mode of the grid profile.
- map.multigrid.profiles.$name.visible
Default:
trueType: boolean
Make this item visible at startup.
- map.multigrid.profiles.$name.composition
Default:
src-overValues:
src-over, dst-over, clear, src, dst, src-in, dst-in, src-out, dst-out, src-atop, dst-atop, xor, plus, multiply, screen, darken,lighten, color-dodge, color-burn, hard-light, soft-light, difference, src-and-dst, src-xor-dst, not-src-and-not-dst, not-src-or-not-dst, not-src-xor-dst, not-src, not-src-and-dst, src-and-not-dstType: string
Sets the composition mode. Specifies how the pixels of the grid(the source) are merged with the pixels of the map(the destination).
See the QT documentation: https://doc.qt.io/archives/qt-4.8/qpainter.html#CompositionMode-enum for the modes.
- map.multigrid.profiles.$name.renderBackToFront
Default:
falseType: boolean
If true, render polygons in inverse value order, highest value first and lowest value last.
- map.multigrid.profiles.$name.stops
Type: gradient
Gradient used for rendering the grid. Overridden by configuration of gradients parameters.
Example (value:color:style):
30.00:ff00fa:”major”,60.00:f25ffb:”minor”
where minor and major refer to the name of style profiles which must be defined.
- map.multigrid.profiles.$name.style
Default:
falseType: string
Name of defined style profile(s) to be considered. Can be omitted if styles are named in ‘stops’.
- map.multigrid.styles.$name.brush.color
Default:
000000FFType: string
The brush color following the color definition in SeisComP: color-code name, rgb or hexadecimal representation.
- map.multigrid.styles.$name.gradient.name
Values:
Default, Spectrum, Circle, BlackBody, Inferno, Plasma, BlackWhite, WhiteBlack, BuPu, Blues, PuRd, RdYlBu, Parula, ViridisType: string
Name of the standard built-in gradient. Read the documentation of color gradients for the details. Configuration of a gradients overrides configured stops.
- map.multigrid.styles.$name.gradient.min
Type: double
Minimum value of the target value range.
- map.multigrid.styles.$name.gradient.max
Type: double
Maximum value of the target value range.
- map.multigrid.styles.$name.gradient.alpha
Default:
50Range:
[0:255]Type: integer
Transparency. Overrides the alpha value of the gradient.
- map.multigrid.styles.$name.gradient.nodes
Default:
-1Type: integer
Number of nodes at which to define the color gradient. The respective values will be shown in legends.
< 2: Use nodes originally defined by gradient.
- map.multigrid.styles.$name.brush.pattern
Default:
solidValues:
solid, dense1, dense2, dense3, dense4, dense5, dense6, dense7, nobrush, horizontal, vertical, cross, bdiag, fdiag, diagcrossType: string
The brush pattern.
- map.multigrid.styles.$name.pen.color
Default:
000000FFType: string
The pen color following the color definition in SeisComP: color-code name, rgb or hexadecimal representation.
- map.multigrid.styles.$name.pen.style
Default:
solidlineValues:
nopen, solidline, dotline, dashline, dashdotline, dashdotdotlineType: string
The pen style.
- map.multigrid.styles.$name.pen.width
Default:
1.0Unit: px
Type: double
The pen width.