gis documentation
This is the documentation for the gis package in version 2025.112#0bb1a5f43.


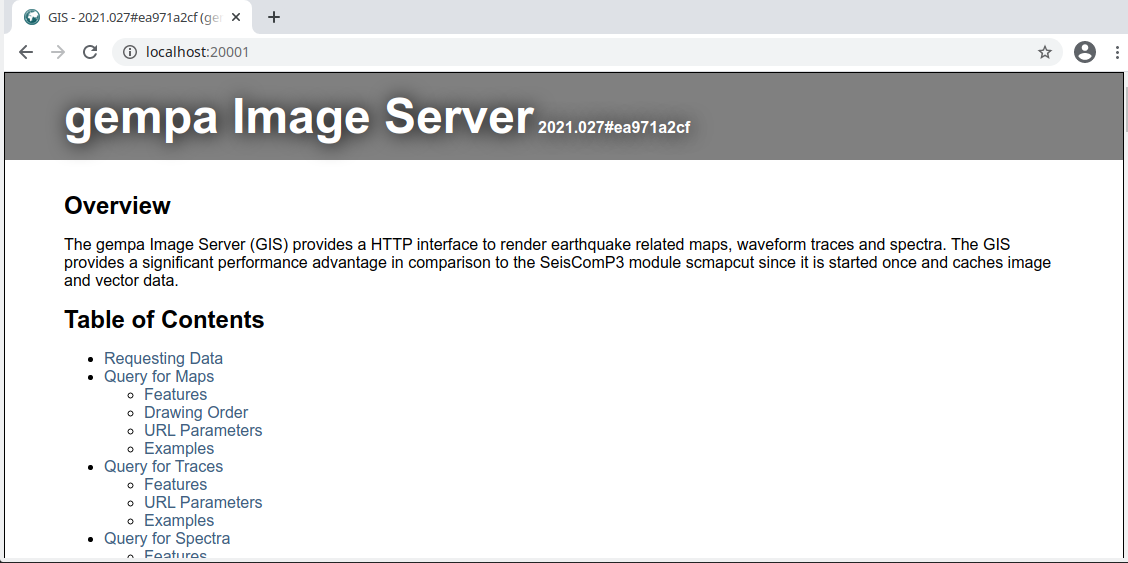
GIS server Web page with request decriptions and examples.
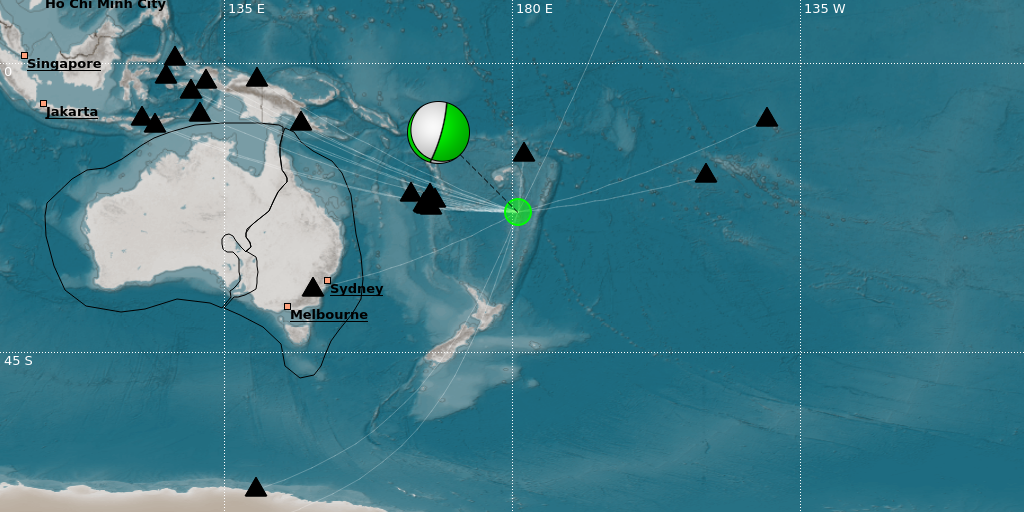
GIS generates maps with detailed event information.
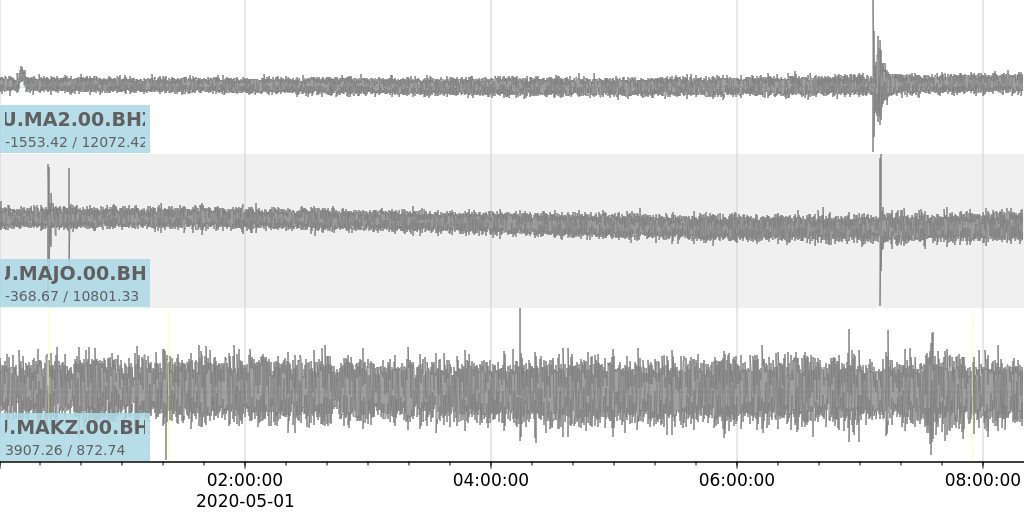
Waveform plots are created with additional information.
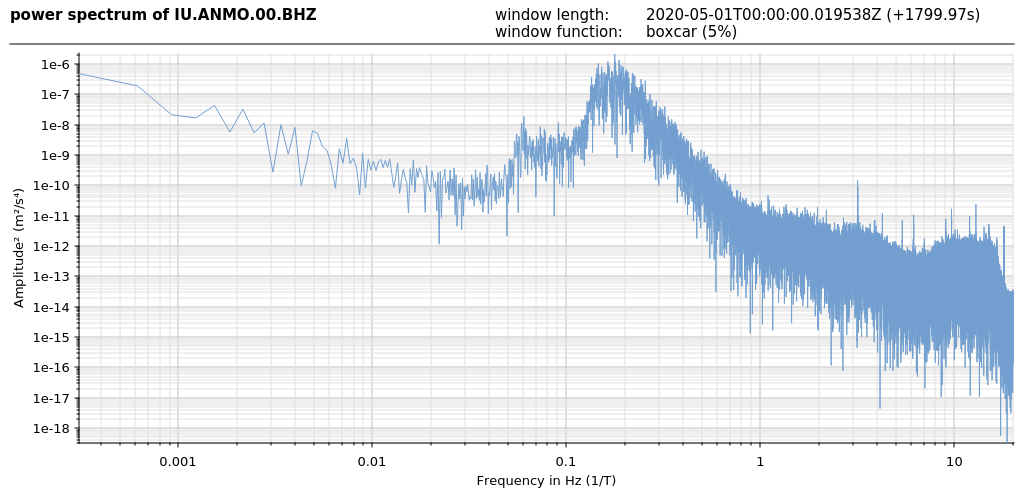
Amplitude, phase or power spectra from waveforms can be plotted.
About
gis - the gempa Image Server - is a gempa module for generating images from events and waveforms.