gis
Gempa Image Server - Tiny Web server for maps, tiles and trace images
Description
GIS is an image server allowing to generate images of various kinds showing event information, maps or waveform data. The images are generated upon request and delivered in all formats supported by Qt: PNG, JPG, JPEG, BMP, PPM, TIFF, XBM, XPM.
Event information on a map, optionally along with contributing stations,
Station information on a map,
Waveform data:
composite images consisting of any components from above can be generated by GIS or external tools.
The images can be generated interactively on demand or automatically and on demand by other modules, e.g. GDS [1].
Note
The GIS package is automatically provided as a separate package when purchasing GDS [1].
Data Sources
GIS collects data from different sources depending on the requested data type. The source must be configured or the information must be provided:
Event parameters: Provided by HTTP POST as event XML. This includes:
events with preferred origin, magnitude and focal mechanism / moment tensor,
origins with arrivals and magnitudes,
moment tensors
Inventory: Read from the SeisComP database or from a provided inventory XML file,
Waveforms: Read from the configured RecordStream.
Important
The RecordStream configuration must not include any real-time source, such as seedlink without a timeout. Use the option ?arch when fetching data from a CAPS server using the caps RecordStream.
Example configurations:
seedlink only with short time out:
recordstream = slink://localhost:18000?timeout=1&retries=0
caps only with archive option:
recordstream = caps://localhost:18002?arch
seedlink combined with gempa’s router RecordStream. The plugin rsrouter must be loaded
plugins = ${plugins},rsrouter
recordstream = combined://slink/localhost:18000?timeout=1&retries=0;router/@SYSTEMCONFIGDIR@/router.conf
Map:
Map Tiles - loaded from local tile store or map server,
Geo Features - loaded from
spatial/vectordirectory inSYSTEMCONFIGDIRorCONFIGDIR,Geo Features - transmitted as JSON documents via HTTP POST,
Geo Images - transmitted via HTTP POST in order of their transmission,
Vector Layer - coordinate grid, cities loaed from cities XML file,
Screen Images - transmitted via HTTP POST in order of their transmission.
Generating Requests
The GIS supports HTTP-GET and HTTP-POST requests. The detailed keys, values and descriptions are provided by the documentation on the webpage created by the GIS server itself. The website is provided by the GIS server on port 20001 by default. To view the website, start the SeisComP messaging and gis:
seiscomp start scmaster
seiscomp exec gis --debug
Then open the website with the configured port and view the options:
firefox localhost:20001
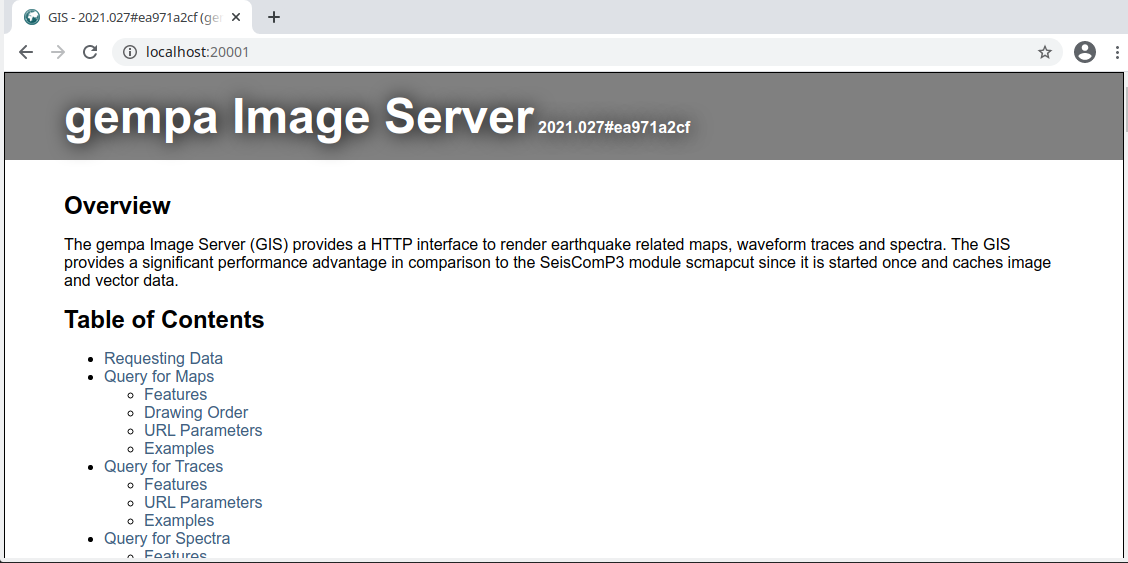
Figure 1: GIS web page exposed by default on http://localhost:20001.
Sending Requests
Requests can be sent to the GIS server in different ways depending on the request content:
A custom Python script
Linux commands like wget or curl
Find some examples in the section Examples.
Examples
Maps may contain event and station information alone or together. Data is shown as time series or Fourier spectra. This section provides examples for generating images interactively on demand.
Map with event and stations
Plot event information from one more events along with stations providing arrivals.
The event and station
information are provided in a single file event-inventory.xml. Generate this
file using scxmlmerge [3] or provide the inventory to gis from the database:
scxmlmerge event.xml inventory.xml > event-inventory.xml
curl -X POST -d @event-inventory.xml "http://localhost:20001/map?&dim=1024,512&stations=*&®=-30,180,40,20" -o /tmp/gis-event-map.png
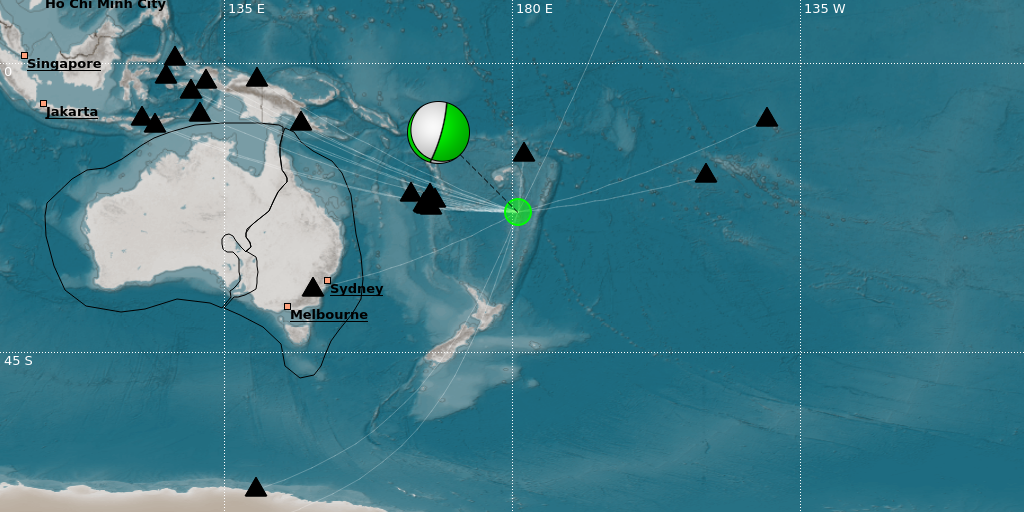
Figure 2: Map with event information, map features and stations providing arrivals.
Multiple events are plotted if contained in the event XML file.
Map with stations
Generate a map of stations. Post the inventory XML file and draw all stations. The file can be created using scxmldump [2]. Example:
scxmldump -d localhost -If -o inventory.xml
curl -X POST -d @inventory.xml "http://localhost:20001/map?&dim=1024,512®=0,110,20,10&stations=*" -o /tmp/gis-stations.png
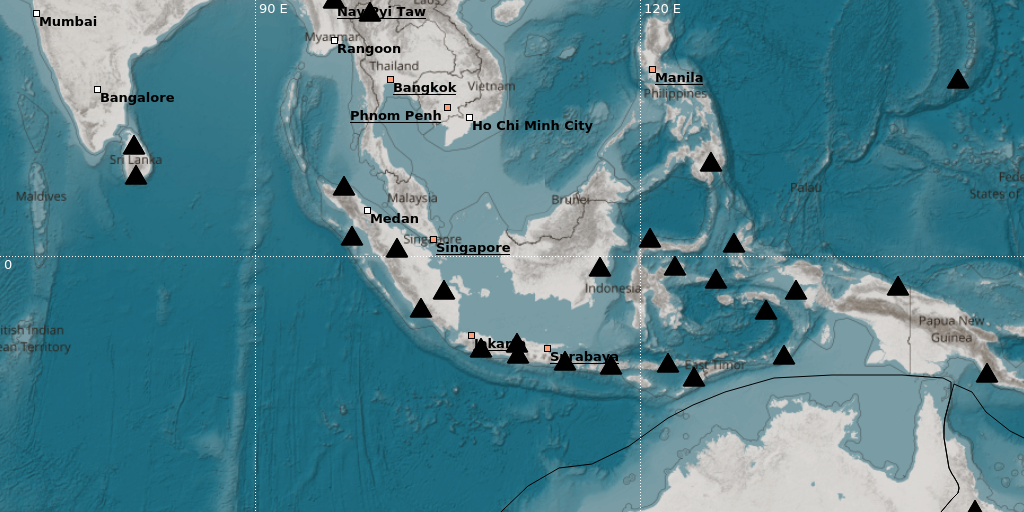
Figure 3: Example of a map with stations from inventory.
Waveform data with arrivals from event
Generate plots of waveforms with arrival information from one event. The posted
file event.xml contains the complete event information. The file can be
created for an event with ID eventID using scxmldump [2], e.g.:
scxmldump -d localhost -E [eventID] -PAf -o event.xml
curl -X POST -d @event.xml "http://localhost:20001/traces?dim=1024,1024&num=7&fmt=png&buffersize=360&orderby=distance&removeoffset=1&weight=1.0&filter=BW(3,1.0,9.0)&showpicks=true&showtt=true&start=2021-02-03T05:28:00&range=10000000&usegain=true" -o /tmp/gis-traces-arrivals.png
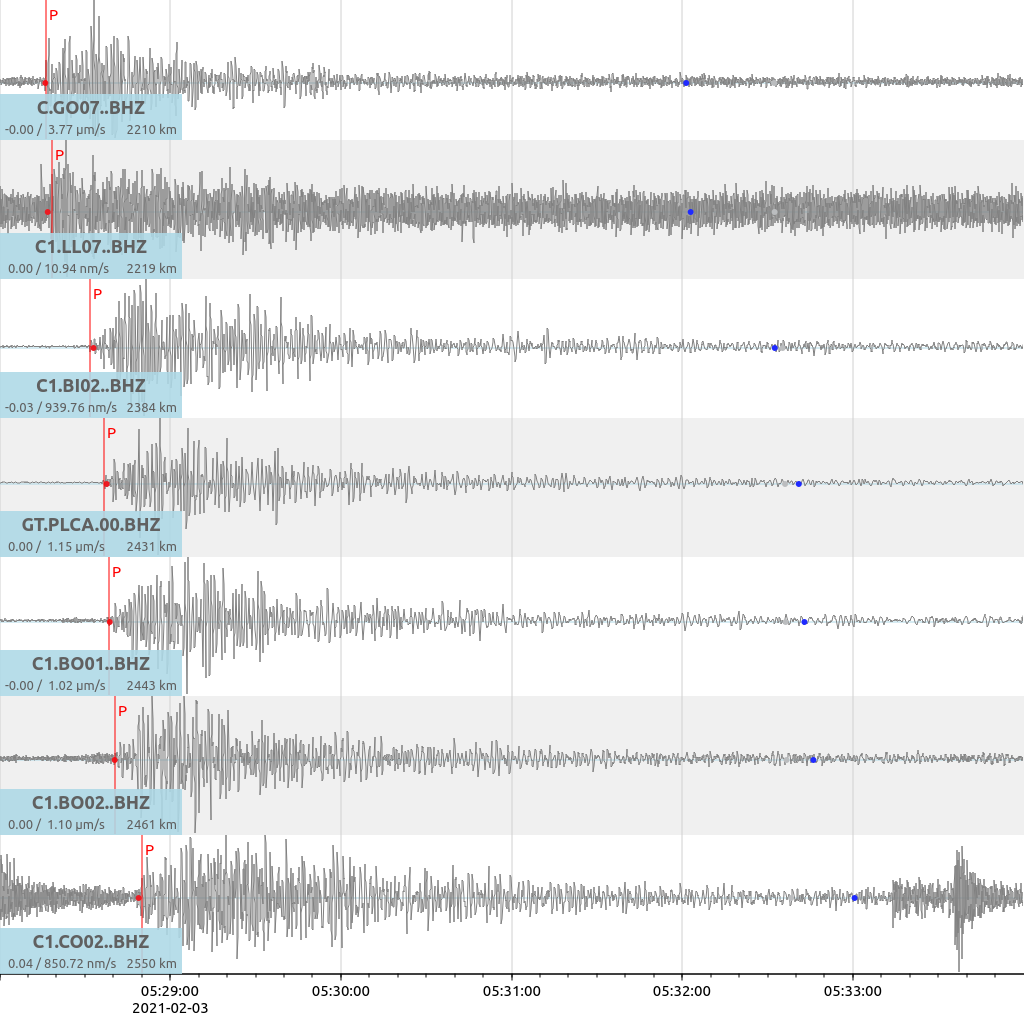
Figure 4: Example of a trace plot with arrival information.
While the measured phased arrivals are marked by red symbols, the theoretical times are indicated with blue dots.
Waveform data for a time window
Generate plots of waveforms for a given time range. Apply the gain to show physical units:
wget -O /tmp/gis-traces.png "http://localhost:20001/traces?streams=IU.M*.00.BHZ&dim=1024,700&start=2020-05-01&bufferSize=30000&num=5&usegain=true"
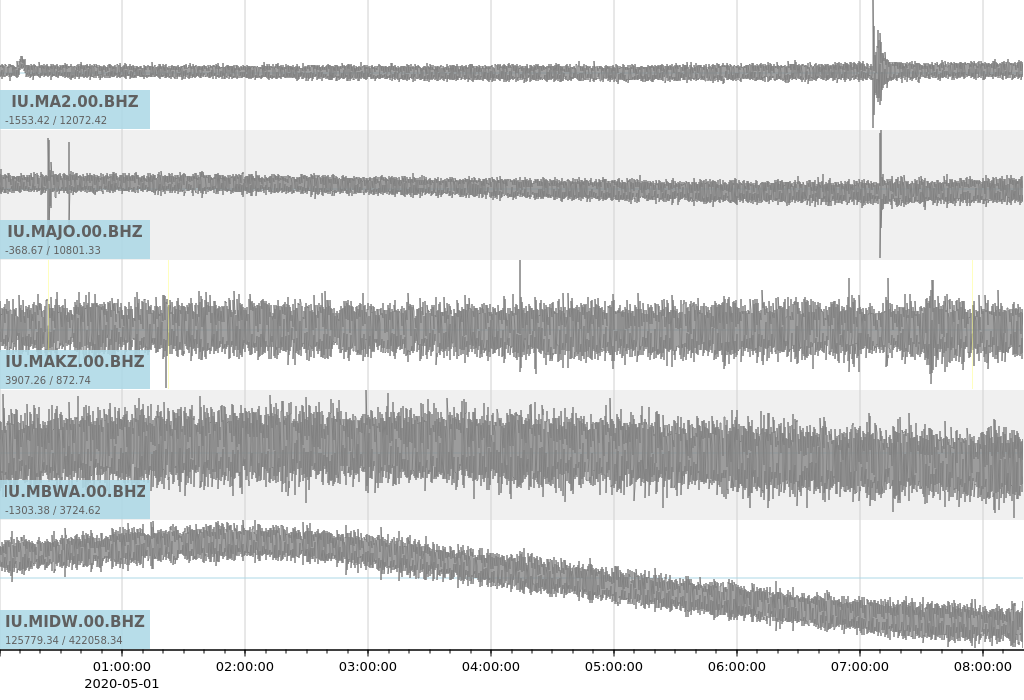
Figure 5: Example of a trace plot.
Fourier spectra for a time window
Generate Fourier spectra from waveform data:
Amplitude spectra
wget -O /tmp/gis-spectra.png "http://localhost:20001/spectra?stream=IU.ANMO.00.BHZ&dim=1024,500&start=2020-05-01&mode=phase"
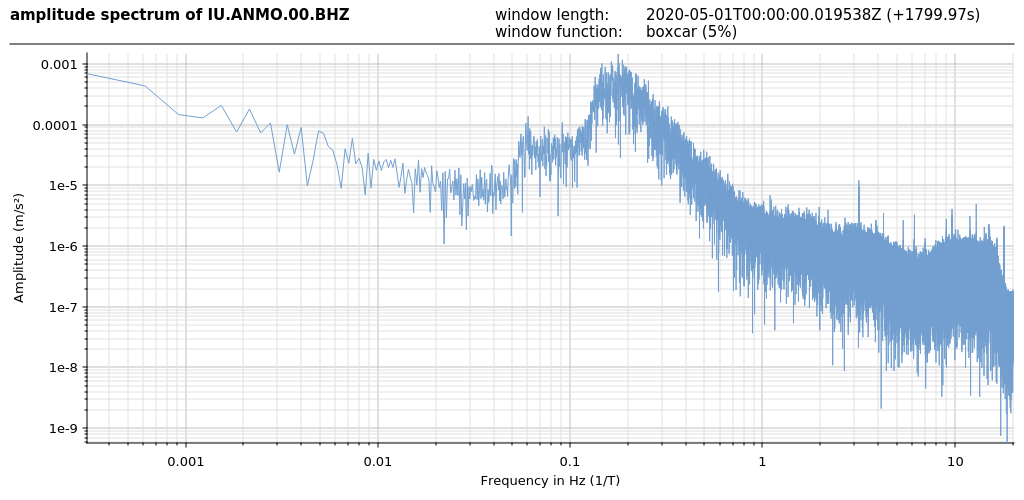
Figure 6: Example of a Fourier amplitude spectrum.
Phase spectra
wget -O /tmp/gis-spectra-phase.png "http://localhost:20001/spectra?stream=IU.ANMO.00.BHZ&dim=1024,500&start=2020-05-01&mode=phase"

Figure 7: Example of a Fourier phase spectrum.
Power spectra
wget -O /tmp/gis-spectra-power.png "http://localhost:20001/spectra?stream=IU.ANMO.00.BHZ&dim=1024,500&start=2020-05-01&mode=power"
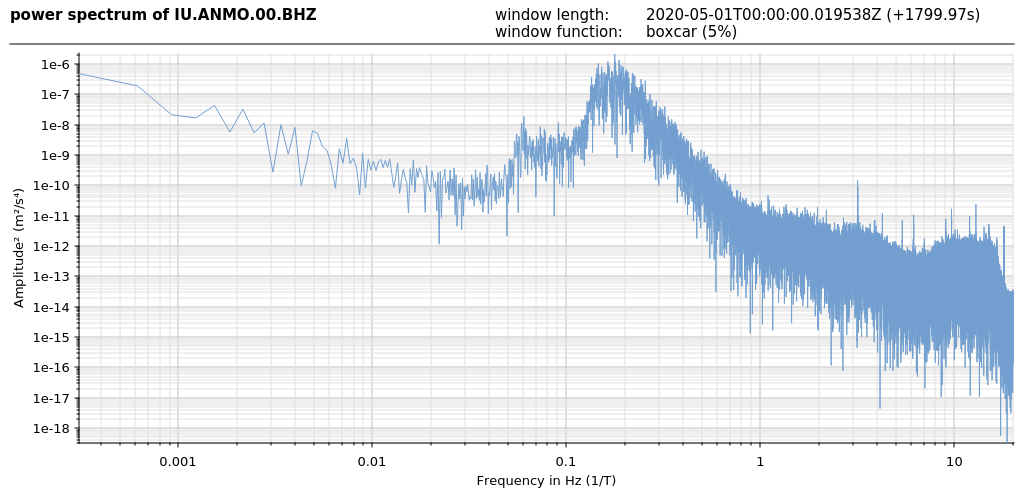
Figure 8: Example of a Fourier power spectrum.
Composite images
GIS can generate composite images consisting of different images generated before.
Module Configuration
etc/defaults/global.cfgetc/defaults/gis.cfgetc/global.cfgetc/gis.cfg~/.seiscomp/global.cfg~/.seiscomp/gis.cfggis inherits global options.
Note
Modules/plugins may require a license file. The default path to license
files is @DATADIR@/licenses/ which can be overridden by global
configuration of the parameter gempa.licensePath. Example:
gempa.licensePath = @CONFIGDIR@/licenses
- dbDisable
Default:
falseType: boolean
If set to true, no inventory and configuration is fetched from the database. Also no connection attempt to the messaging system is made to retrieve the database parameters.
- bind
Default:
127.0.0.1:20001Type: host-with-port
IP and port to bind the command interface to. Use 0.0.0.0 to bind to all interfaces. Either the port or the IP address may be omitted, e.g. "0.0.0.0" or ":1234". If set to an empty string the application will run without providing a command interface.
- rootURL
Type: string
Defines the root URL used to generate links. That option is only important if e.g. Apache with reverse proxy is used to forward GIS webpages.
- mediaDirectory
Default:
@DATADIR@/gis/mediaType: string
Path to media files (index.html, .css, .js, .ico, …) served by GIS.
- accessLog
Default:
falseType: boolean
Enables HTTP access logging to @LOGDIR@/gis-http-access. Logfiles are created for 24h and kept for 7 days using log rotation.
- ttt
Default:
libtauType: string
Name of travel time table interface, e.g. ‘libtau’ or ‘locsat’
- ttColors
Type: list:string
List of case sensitive phase name to color mappings, e.g. "P:red,S:#00ff00,PP:#aabbcc". Unmapped phases are not drawn.
- ttRadius
Default:
3Unit: px
Type: double
Radius of the travel time circles
- errorImage
Default:
falseType: boolean
If enabled errors will be reported inside an image file. The HTTP status code will be set to ‘200 OK’ in this case.
- urlLen
Default:
1024Type: int
Maximum number of URL characters.
- tilesTimeout
Default:
0Unit: s
Type: double
Timeout in seconds after which the download of tiles should be aborted. On timeout the requested map image is rendered with an incomplete image layer. This option is only used if an asynchronous tile store is configured.
- originSymbol
Type: string
Origin symbol image. If defined the image is plotted instead of the standard circle. The size and color still depends on the magnitude and depth.
Command-Line Options
Generic
- -h, --help
Show help message.
- -V, --version
Show version information.
- --config-file file
The alternative module configuration file. When this option is used, the module configuration is only read from the given file and no other configuration stage is considered. Therefore, all configuration including the definition of plugins must be contained in that file or given along with other command-line options such as --plugins.
- --plugins arg
Load given plugins.
- -D, --daemon
Run as daemon. This means the application will fork itself and doesn’t need to be started with &.
Verbosity
- --verbosity arg
Verbosity level [0..4]. 0:quiet, 1:error, 2:warning, 3:info, 4:debug.
- -v, --v
Increase verbosity level (may be repeated, e.g., -vv).
- -q, --quiet
Quiet mode: no logging output.
- --component arg
Limit the logging to a certain component. This option can be given more than once.
- -s, --syslog
Use syslog logging backend. The output usually goes to /var/lib/messages.
- -l, --lockfile arg
Path to lock file.
- --console arg
Send log output to stdout.
- --debug
Execute in debug mode. Equivalent to --verbosity=4 --console=1 .
- --log-file arg
Use alternative log file.
Server
- -p, --port arg
Overrides configuration parameter
port.