smgui
smgui is a module to analyse seimsic traces in terms of common strong ground motion parameters to fulfill the requirements of engineering seismology
Description
SMGUI (Strong Motion Graphical User Interface)
Introduction
smgui is a module to analyse seimsic traces in terms of common strong ground motion parameters to fulfill the requirements of engineering seismology. The userfriendly GUI allows for example the calculation of
Root-mean-square (RMS) of acceleration, velocity and displacement
Arias (Ia) and characteristic (Ic) intensities
Cumulative Absolute Velocity (CAV) and Specific Energy Density (SED)
Effective design acceleration (EDA)
predominant (Tp) and mean (Tm) periods
Fourier and Power spectra
Response spectra
It also allows to filter the frequency content of the given signal and filtering prior to time-integration of the signal (to obtain velocity and displacement time-histories).
smgui is able to read waveform data from any data service supported from SeisComP3 as SeedLink, ArcLink, file, sdsarchive etc.
Finally, and due to its full integration within SeisComP3, smgui complements the functionality of SeisComP3 regarding strong motion analysis. Waveforms and results can be exported in ASCII format.
Start
The smgui can be started by
./seiscomp exec smgui -H 127.0.0.1 -I arclink://127.0.0.1:18001
Usage
Data selection
The Figure below shows the starting page of smgui. On the left side is the loaded inventory showing all available networks. These networks can be browsed down to the channel level (for example BHZ).
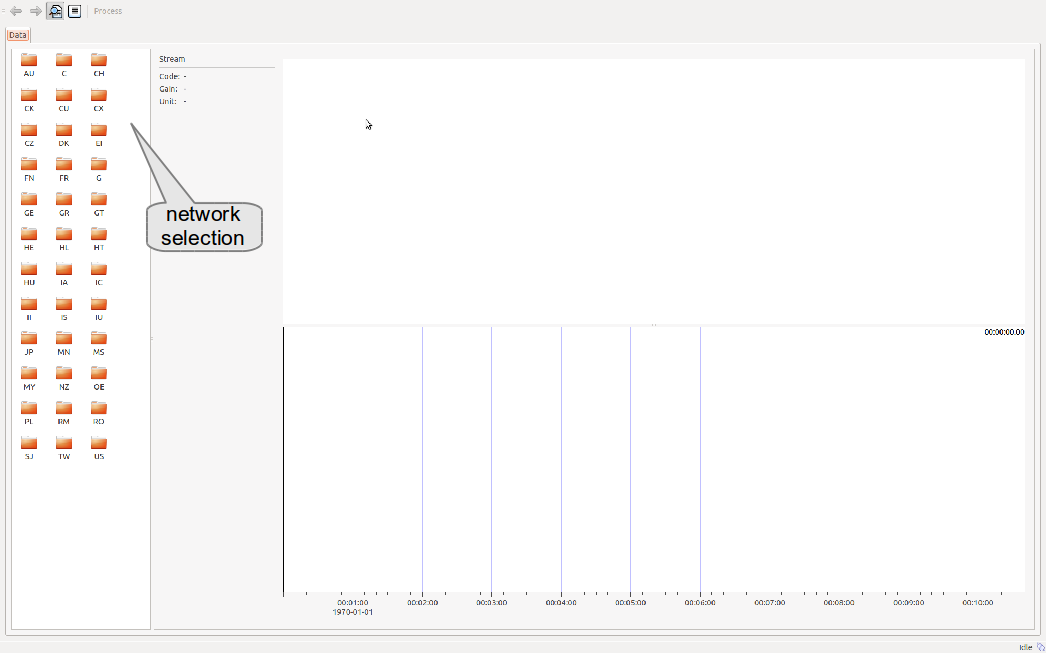
Screenshot of initial view
Once a channel is selected, the waveforms are loaded. The right side of smgui shows the spectrogram in the upper part and the corresponding waveforms in the lower part.
By a left click on the time scale, the time window can be panned. Using the right mouse button and holding it, a zooming in time is possible. To zoom in, left click on the start time, hold the mouse button, move to the right and release the button when the end time is reached. A green horizontal bar should appear in case the selection was successful. To zoom out, to the same, but move the mouse to the left side. A red bar should appear in case the time window selection was successful.
To select the processing time window, left click in the waveforms to select the start time, hold the button and move the mouse to the end time. Then release the mouse button. The select time window should be marked. It can be either reselected or the black triangles on the time scale can be moved to change start and ent time. The figure below shows an example of a data selection.
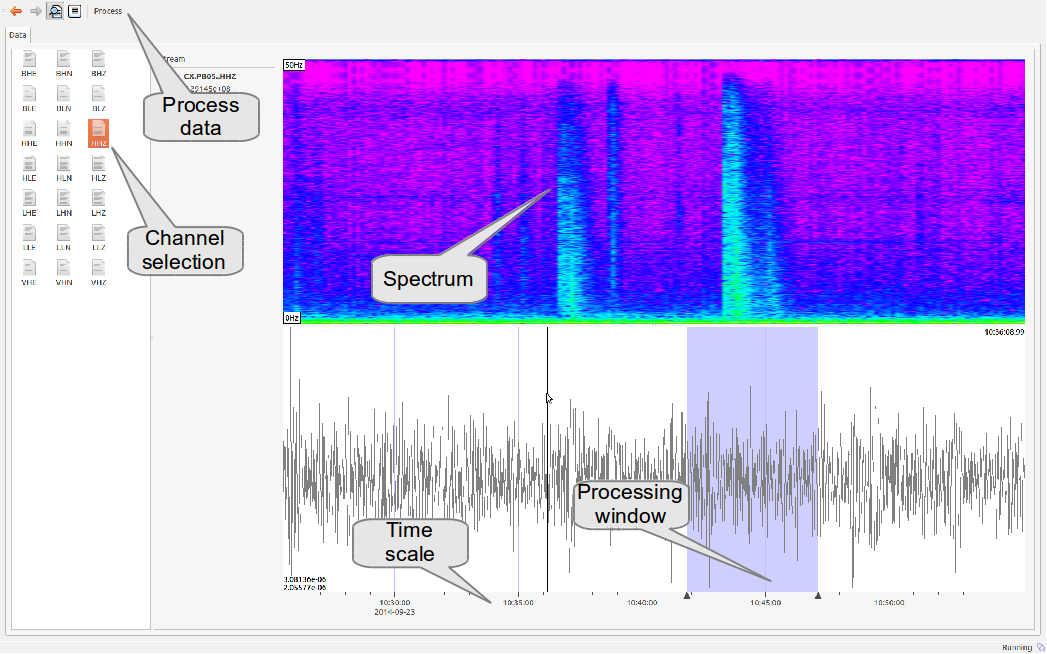
Screenshot of data selection
Data processing
After the channel and time window is selected, the user can calculate the strong motion parameter through a click on the process button. The figure below shows the processing results page. .. _fig-results:
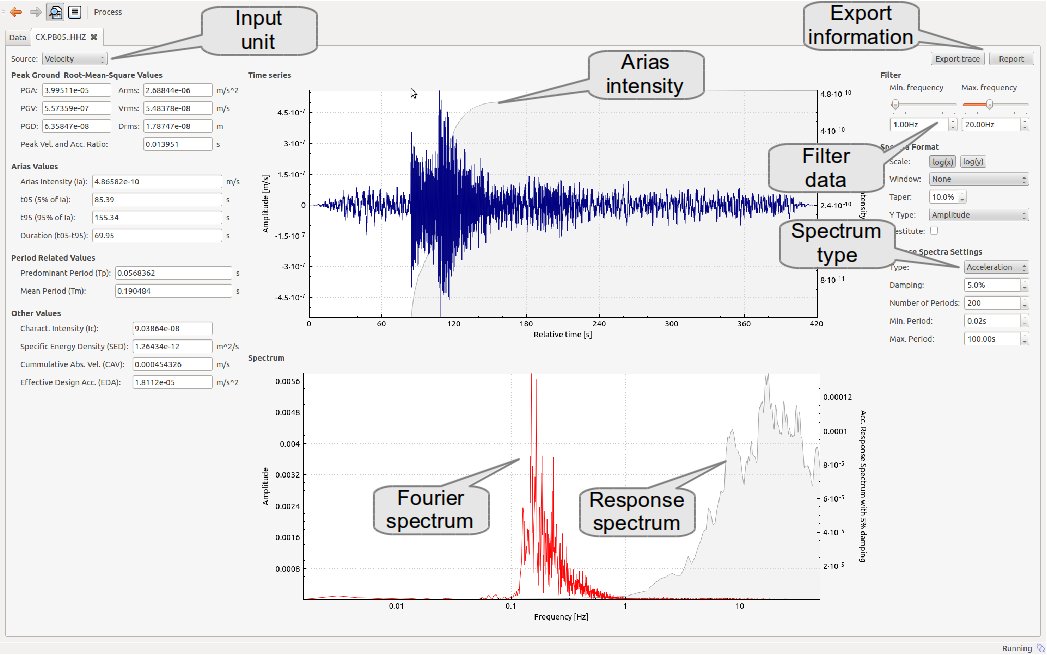
Screenshot of processing results
The processing results as well as the waveform data can be exported in a flat ASCII file.
Module Configuration
etc/defaults/global.cfgetc/defaults/smgui.cfgetc/global.cfgetc/smgui.cfg~/.seiscomp/global.cfg~/.seiscomp/smgui.cfgsmgui inherits global options.
Note
Modules/plugins may require a license file. The default path to license
files is @DATADIR@/licenses/ which can be overridden by global
configuration of the parameter gempa.licensePath. Example:
gempa.licensePath = @CONFIGDIR@/licenses
- disableMessaging
Default:
falseType: boolean
Switch to offline mode